

Answered step by step
Verified Expert Solution
Question
1 Approved Answer
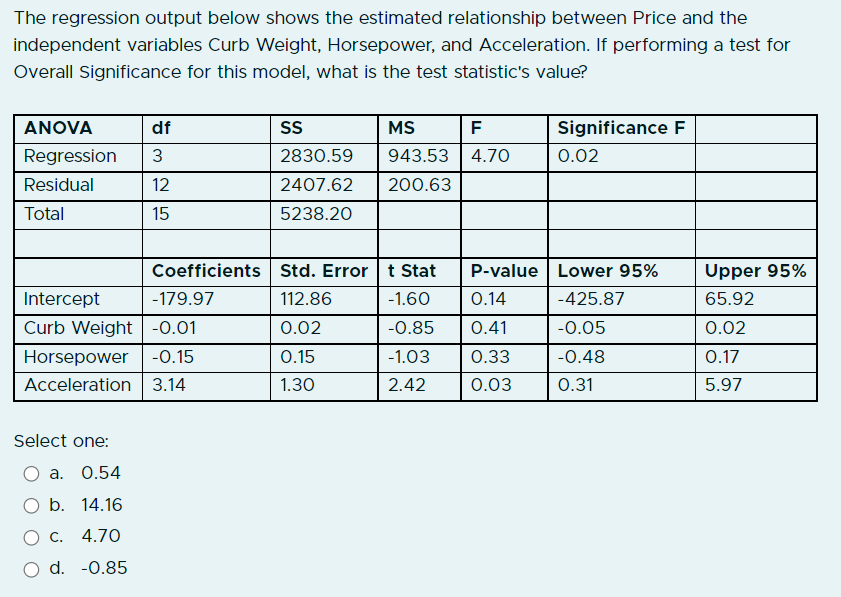
The regression output below shows the estimated relationship between Price and the independent variables Curb Weight, Horsepower, and Acceleration. If performing a test for Overall

Step by Step Solution
There are 3 Steps involved in it
Step: 1

Get Instant Access to Expert-Tailored Solutions
See step-by-step solutions with expert insights and AI powered tools for academic success
Step: 2

Step: 3
Ace Your Homework with AI
Get the answers you need in no time with our AI-driven, step-by-step assistance
Get Started
Topology
Authors: Marco Manetti
1st Edition
3319169580, 9783319169583