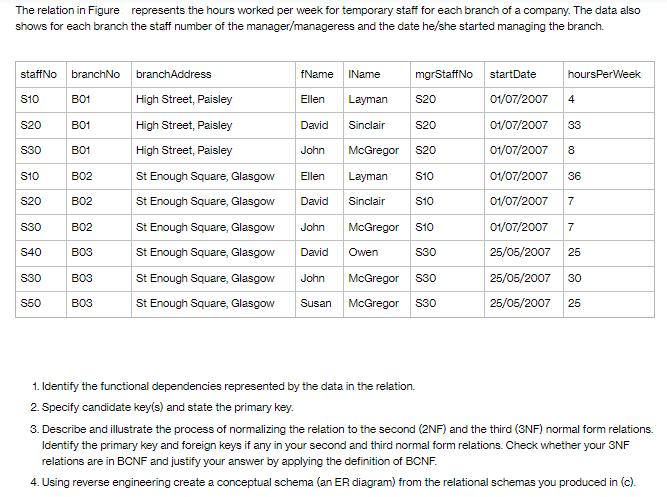
Question: The relation in Figure represents the hours worked per week for temporary staff for each branch of a company. The data also shows for

The relation in Figure represents the hours worked per week for temporary staff for each branch of a company. The data also shows for each branch the staff number of the manager/manageress and the date he/she started managing the branch. staffNo branchNo S10 S20 S30 S10 S20 S30 S40 S30 S50 B01 B01 B01 B02 B02 B02 B03 B03 B03 branchAddress High Street, Paisley High Street, Paisley High Street, Paisley St Enough Square, Glasgow St Enough Square, Glasgow St Enough Square, Glasgow St Enough Square, Glasgow St Enough Square, Glasgow St Enough Square, Glasgow fName IName Ellen Layman Sinclair mgrStaffNo David John McGregor Ellen Layman David Sinclair S20 S20 S20 S10 S10 John McGregor S10 David Owen John McGregor $30 Susan McGregor S30 S30 hoursPerWeek startDate 01/07/2007 4 01/07/2007 33 01/07/2007 8 01/07/2007 36 01/07/2007 7 01/07/2007 7 25/05/2007 25 25/05/2007 30 25/05/2007 25 1. Identify the functional dependencies represented by the data in the relation. 2. Specify candidate key(s) and state the primary key. 3. Describe and illustrate the process of normalizing the relation to the second (2NF) and the third (3NF) normal form relations. Identify the primary key and foreign keys if any in your second and third normal form relations. Check whether your 3NF relations are in BCNF and justify your answer by applying the definition of BCNF. 4. Using reverse engineering create a conceptual schema (an ER diagram) from the relational schemas you produced in (c).
Step by Step Solution
There are 3 Steps involved in it
You have provided an image with instructions related to database normalization and reverse engineering an ER diagram from a relational schema Lets go through each point step by step 1 Identify the fun... View full answer

Get step-by-step solutions from verified subject matter experts


