

Question
The relationship between the four components of the ACT exam. Select the appropriate scatterplots of ACT #1 score vs ACT #2 score, where the first
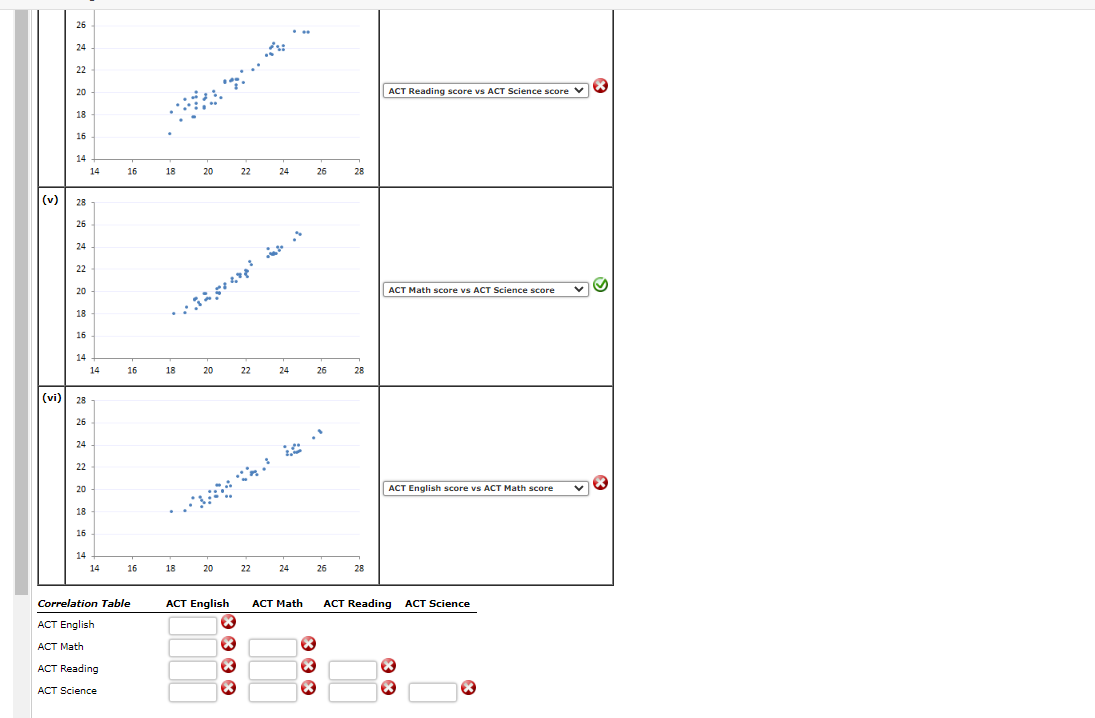
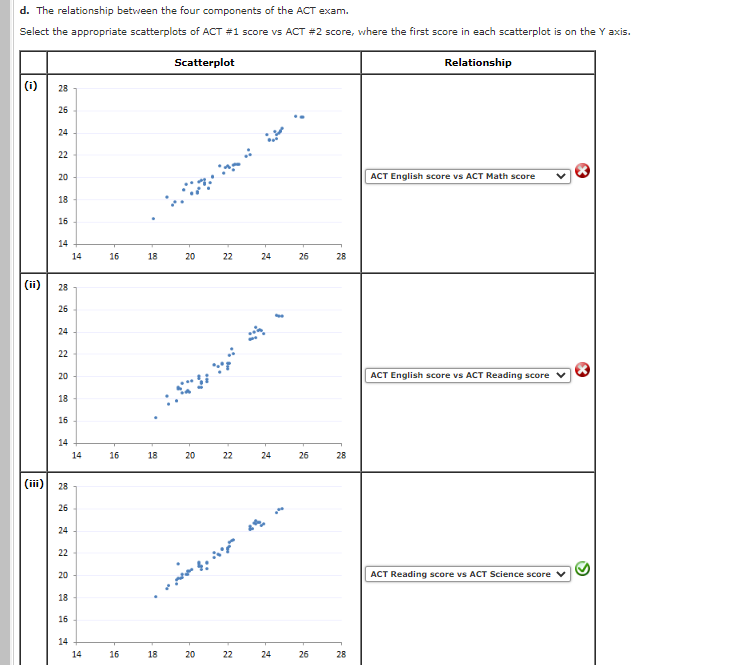
The relationship between the four components of the ACT exam.
Select the appropriate scatterplots of ACT #1 score vs ACT #2 score, where the first score in each scatterplot is on the Y axis.
Step by Step Solution
There are 3 Steps involved in it
Step: 1

Get Instant Access to Expert-Tailored Solutions
See step-by-step solutions with expert insights and AI powered tools for academic success
Step: 2

Step: 3
Ace Your Homework with AI
Get the answers you need in no time with our AI-driven, step-by-step assistance
Get Started
Calculus Early Transcendental Single Variable
Authors: Howard Anton, Irl C Bivens, Stephen Davis
11th Edition
1118885589, 9781118885581