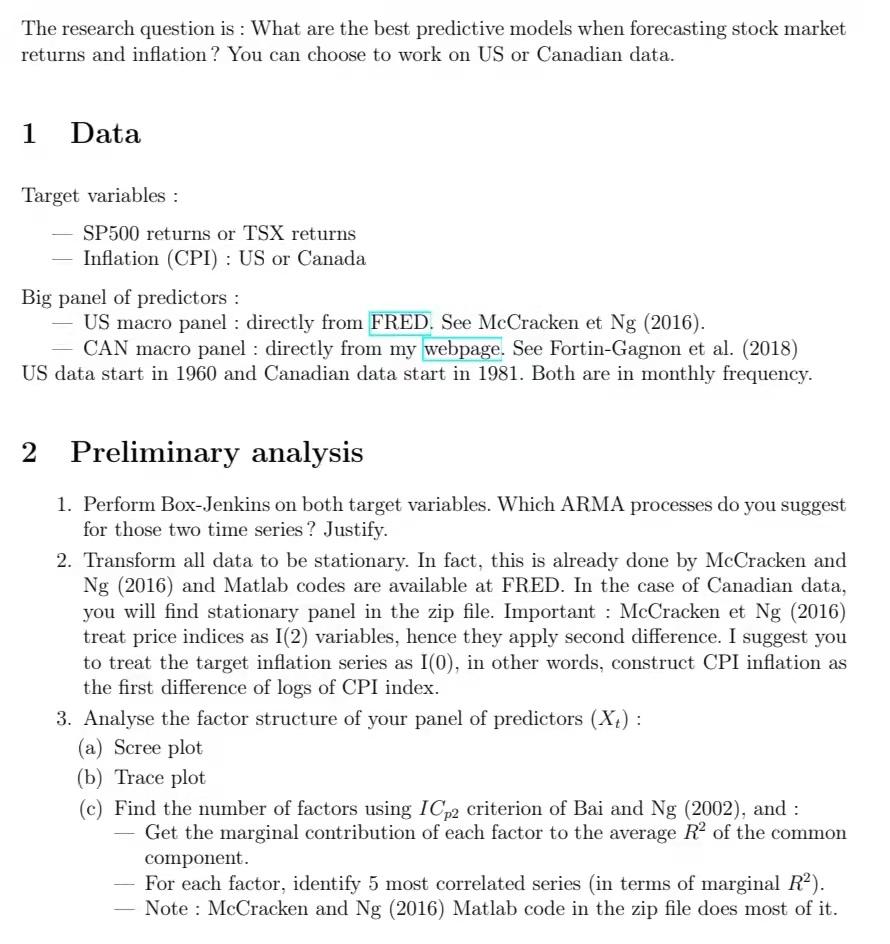
The research question is: What are the best predictive models when forecasting stock market returns and inflation? You can choose to work on US or Canadian data. 1 Data Target variables : SP500 returns or TSX returns Inflation (CPI): US or Canada Big panel of predictors: US macro panel : directly from FRED. See McCracken et Ng (2016). CAN macro panel : directly from my webpage. See Fortin-Gagnon et al. (2018) US data start in 1960 and Canadian data start in 1981. Both are in monthly frequency. 2 Preliminary analysis 1. Perform Box-Jenkins on both target variables. Which ARMA processes do you suggest for those two time series? Justify. 2. Transform all data to be stationary. In fact, this is already done by McCracken and Ng (2016) and Matlab codes are available at FRED. In the case of Canadian data, you will find stationary panel in the zip file. Important : McCracken et Ng (2016) treat price indices as I(2) variables, hence they apply second difference. I suggest you to treat the target inflation series as I(0), in other words, construct CPI inflation as the first difference of logs of CPI index. 3. Analyse the factor structure of your panel of predictors (Xt): (a) Scree plot (b) Trace plot (c) Find the number of factors using ICp2 criterion of Bai and Ng (2002), and : Get the marginal contribution of each factor to the average R2 of the common component. For each factor, identify 5 most correlated series in terms of marginal R2). Note : McCracken and Ng (2016) Matlab code in the zip file does most of it. The research question is: What are the best predictive models when forecasting stock market returns and inflation? You can choose to work on US or Canadian data. 1 Data Target variables : SP500 returns or TSX returns Inflation (CPI): US or Canada Big panel of predictors: US macro panel : directly from FRED. See McCracken et Ng (2016). CAN macro panel : directly from my webpage. See Fortin-Gagnon et al. (2018) US data start in 1960 and Canadian data start in 1981. Both are in monthly frequency. 2 Preliminary analysis 1. Perform Box-Jenkins on both target variables. Which ARMA processes do you suggest for those two time series? Justify. 2. Transform all data to be stationary. In fact, this is already done by McCracken and Ng (2016) and Matlab codes are available at FRED. In the case of Canadian data, you will find stationary panel in the zip file. Important : McCracken et Ng (2016) treat price indices as I(2) variables, hence they apply second difference. I suggest you to treat the target inflation series as I(0), in other words, construct CPI inflation as the first difference of logs of CPI index. 3. Analyse the factor structure of your panel of predictors (Xt): (a) Scree plot (b) Trace plot (c) Find the number of factors using ICp2 criterion of Bai and Ng (2002), and : Get the marginal contribution of each factor to the average R2 of the common component. For each factor, identify 5 most correlated series in terms of marginal R2). Note : McCracken and Ng (2016) Matlab code in the zip file does most of it


