

Question
The researcher observes a random sample of 200 people playing Rock-Paper-Scissors and finds that 62 of these people choose paper as a first move in
The researcher observes a random sample of 200 people playing Rock-Paper-Scissors and finds that 62of these people choose "paper" as a first move in the game.Use this information to answer Questions 1 through 7.
Using appropriate symbols, our hypotheses in this example are as follows:
Ho: p= 0.333
Ha: p
1. Look carefully at the hypotheses presented above.What does the symbol "p" stand for in these hypotheses?
2. Notice that in the alternative hypothesis presented above, the "" sign or a "?" sign?
3. Given that62out of a random sample of200players chose "paper" as a first move, what will the sample proportion (or ) be? Please compute this value below.
4. To be able to conduct a hypothesis test, we will now need to compute atest statistic(using the following formula). Please attempt to compute this test statistic below, showing as much work as you can. To be as precise as you can be, round the denominator to three decimal places before dividing the value from the numerator by the denominator.
As part of the process of conducting a hypothesis test, we need to find what's called a probability value, or aP-valuefor short. ThisP-value value tells us something about how likely it would be to observe a sample outcome as extreme or more extreme than what we observed, if the null hypothesis is really true. The smaller theP-value, the more unlikely the sample outcome would be under the assumption that the null hypothesis is true. We determine if we have evidence against the null hypothesis, in favor of the alternative hypothesis, based on how theP-value compares to our chosen significance (or alpha) level. If theP-value is less than or equal to the significance level, we say that we have evidence against the null hypothesis. If theP-value is larger than the significance level, we do not have enough evidence against the null hypothesis (i.e., we cannot rule out the null hypothesis as a reasonable explanation for the observed sample outcome).
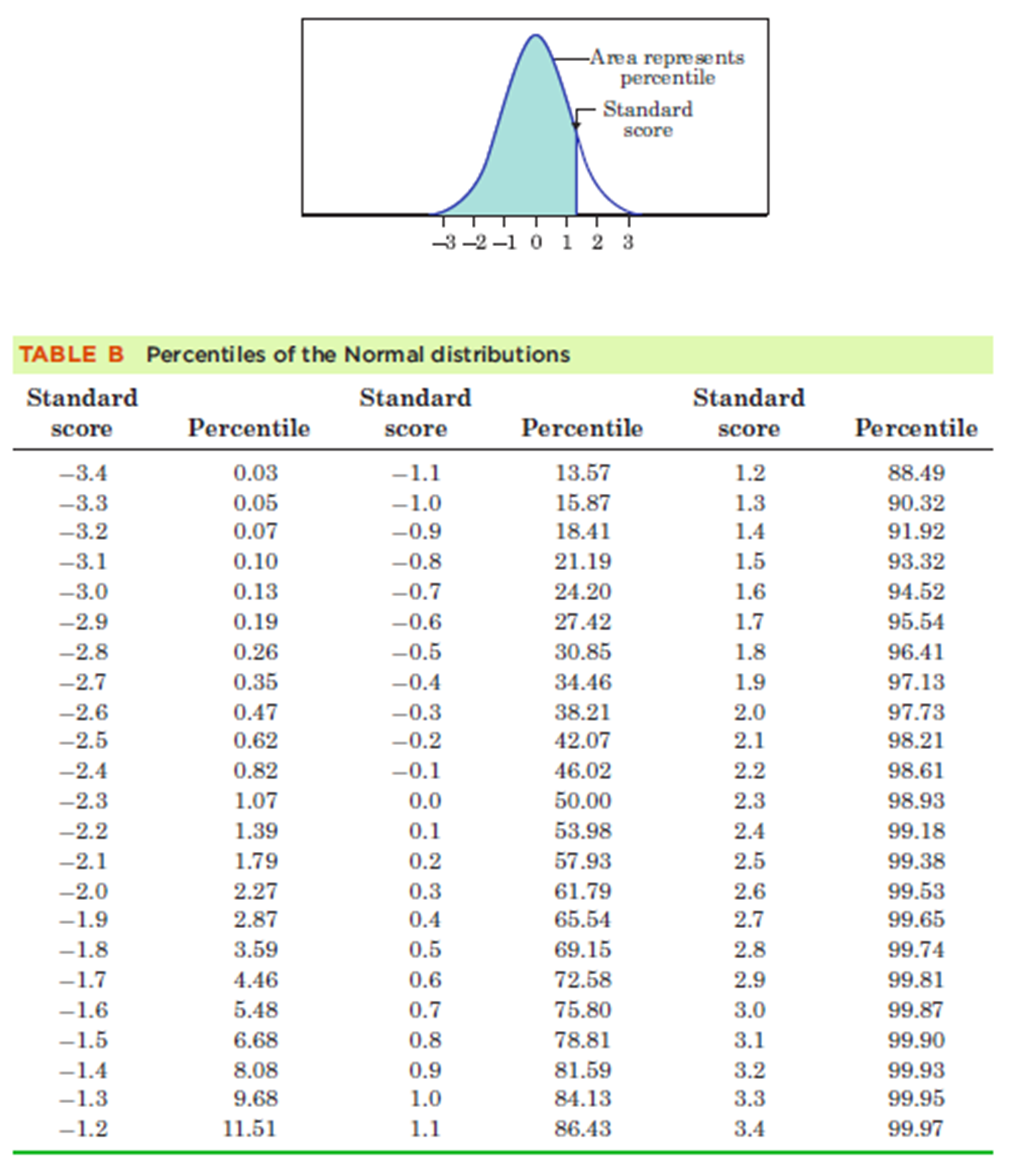
5.Based on the test statisticyou calculated to answer Question 4,what is theP-value equal to? Use Table B to find thisP-value. (Hint: Don't forget that since aP-value is a probability, you will now need to take the percentile you get from Table B and divide it by 100 to convert it to a probability).
6.Assume here that we are using a significance level of0.05.Based on this information, along with theP-value you obtained in your answer to Question 5, what should we conclude about the null hypothesis,and why?
7.In the space below, share the test statistic andP-value you got using the applet.How are the test statistic andP-value you got from the applet different from the values you obtained when answering Questions 4 and 5 above? Please explain.
(I sent you the link below, please watch it for answer question 7)
It is claimed that 25% of adults support the practice of changing clocks twice a year in observance of Daylight Saving Time. Believing this claimed value istoo low, a sociologist surveys a random sample of 500 adults and finds that 145 of these adults say they support the practice of changing clocks twice a year in observance of Daylight Saving Time.
Use the above information to conduct a hypothesis test at a significance (or alpha) level of 0.05.
8.What will the hypotheses be?
Ho:
Ha:
Before you go any further, double-check to make sure you are writing out your hypotheses using proper symbols and signs.
9.What is the sample proportion? Calculate this value below.
10.Calculate the test statistic below, using the same formula that you used when answering Question 4.
11.Based on the test statistic you computed to answer Question 10, along with what you see in Table B, what should theP
value be?
12. Based on theP-value you obtained and how it compares to the significance level of0.05,what is your conclusion?
13.Look again at your answer to Question 12. If a larger significance level had been chosen?like 0.10?would you have reached the same conclusion? Please explain.
14.Again, look back at how you answered Question 12.If a smaller significance level had been chosen?like 0.01?would you have reached the same conclusion? Please explain.
Again, make sure to go to the "Type of Inference" area on the left and select Significance Test. In the upper left corner, where it says "Enter Data," use the dropdown menu to select Number of Successes. Here, for the Daylight Saving Time example, you'll want to type in a sample size of500and a number of successes equal to145.You'll then want to type in a "Null Value" (i.e., the value ofp), and select the appropriate direction for the Alternative hypothesis (i.e., More). Once you do this, notice the sampling distribution that appears in the lower right portion of the screen, with theP-value as the shaded area to the right of the sample proportion.
15.Again, in the space below, write down or type the test statistic andP-value you got using the Art of Stat tool.How do these values compare to what you got by hand when answering Questions 10 and 11?
This is table B
Step by Step Solution
There are 3 Steps involved in it
Step: 1

Get Instant Access to Expert-Tailored Solutions
See step-by-step solutions with expert insights and AI powered tools for academic success
Step: 2

Step: 3
Ace Your Homework with AI
Get the answers you need in no time with our AI-driven, step-by-step assistance
Get Started
Calculus Early Transcendentals Early Transcendentals
Authors: Dennis G Zill, Warren S Wright
4th Edition
0763797375, 9780763797379