Answered step by step
Verified Expert Solution
Question
1 Approved Answer
the revised model that includes size, debt-to-equity, and S&P membership is known as a semi-logarithmic model because the dependent variable is in log form but

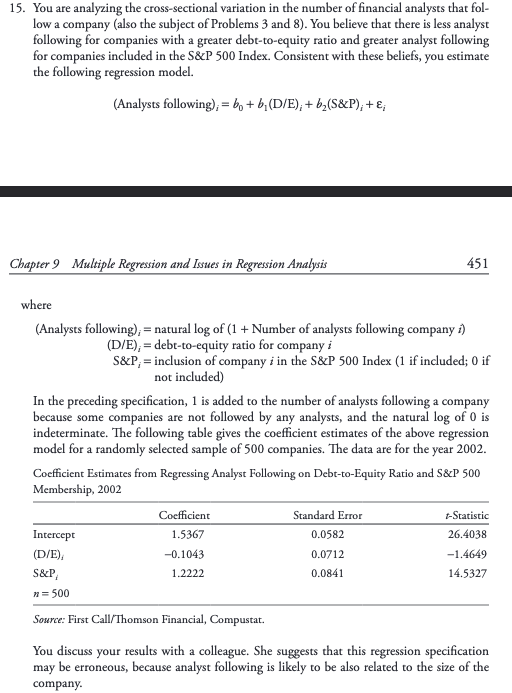
the revised model that includes size, debt-to-equity, and S&P membership is known as a semi-logarithmic model because the dependent variable is in log form but the independent variables are in levels. In a semi-log model, we can use 100 times the estimated coefficients to estimate the percentage change in the dependent variable given a unit increase in the independent variable. For this model, what is the expected percentage change in the number of analysts following a stock if it joins the S&P?
15. You are analyzing the cross-sectional variation in the number of financial analysts that fol- low a company (also the subject of Problems 3 and 8). You believe that there is less analyst following for companies with a greater debt-to-equity ratio and greater analyst following for companies included in the S&P 500 Index. Consistent with these beliefs, you estimate the following regression model. (Analysts following);= be + b, (D/E), + b,(S&P); +; Chapter 9 Multiple Regression and Issues in Regression Analysis 451 where (Analysts following);= natural log of (1 + Number of analysts following company :) (D/E), = debt-to-equity ratio for company i S&P;= inclusion of company i in the S&P 500 Index (1 if included; O if not included) In the preceding specification, 1 is added to the number of analysts following a company because some companies are not followed by any analysts, and the natural log of 0 is indeterminate. The following table gives the coefficient estimates of the above regression model for a randomly selected sample of 500 companies. The data are for the year 2002. Coefficient Estimates from Regressing Analyst Following on Debt-to-Equity Ratio and S&P 500 Membership, 2002 Standard Error Intercept (D/E), -0.1043 -1.4649 S&P 14.5327 Coefficient t-Statistic 26.4038 1.5367 0.0582 0.0712 1.2222 0.0841 = 500 Source: First Call/Thomson Financial, Compustat. You discuss your results with a colleague. She suggests that this regression specification may be erroneous, because analyst following is likely to be also related to the size of the company. 15. You are analyzing the cross-sectional variation in the number of financial analysts that fol- low a company (also the subject of Problems 3 and 8). You believe that there is less analyst following for companies with a greater debt-to-equity ratio and greater analyst following for companies included in the S&P 500 Index. Consistent with these beliefs, you estimate the following regression model. (Analysts following);= be + b, (D/E), + b,(S&P); +; Chapter 9 Multiple Regression and Issues in Regression Analysis 451 where (Analysts following);= natural log of (1 + Number of analysts following company :) (D/E), = debt-to-equity ratio for company i S&P;= inclusion of company i in the S&P 500 Index (1 if included; O if not included) In the preceding specification, 1 is added to the number of analysts following a company because some companies are not followed by any analysts, and the natural log of 0 is indeterminate. The following table gives the coefficient estimates of the above regression model for a randomly selected sample of 500 companies. The data are for the year 2002. Coefficient Estimates from Regressing Analyst Following on Debt-to-Equity Ratio and S&P 500 Membership, 2002 Standard Error Intercept (D/E), -0.1043 -1.4649 S&P 14.5327 Coefficient t-Statistic 26.4038 1.5367 0.0582 0.0712 1.2222 0.0841 = 500 Source: First Call/Thomson Financial, Compustat. You discuss your results with a colleague. She suggests that this regression specification may be erroneous, because analyst following is likely to be also related to the size of the companyStep by Step Solution
There are 3 Steps involved in it
Step: 1

Get Instant Access to Expert-Tailored Solutions
See step-by-step solutions with expert insights and AI powered tools for academic success
Step: 2

Step: 3

Ace Your Homework with AI
Get the answers you need in no time with our AI-driven, step-by-step assistance
Get Started


