

Question
The scatter plot shows the number of years of experience, x ,and the amount charged per hour, y ,for each of 23 dog sitters in
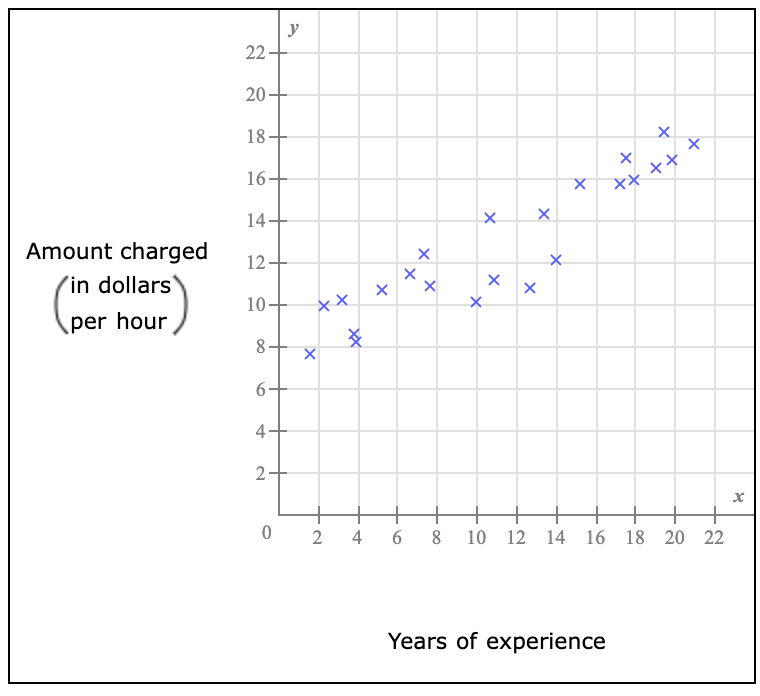
The scatter plot shows the number of years of experience, x,and the amount charged per hour, y,for each of 23 dog sitters in California.
(a) what is the approximate equation of the line of best fit for the data. It doesn't have to be the exact line of best fit.
(b) Using your equation from part (a), predict the amount charged per hour by a dog sitter with 10 years of experience.
Note that you can use the graphing tools to help you approximate the line.
 |
Step by Step Solution
There are 3 Steps involved in it
Step: 1

Get Instant Access to Expert-Tailored Solutions
See step-by-step solutions with expert insights and AI powered tools for academic success
Step: 2

Step: 3
Ace Your Homework with AI
Get the answers you need in no time with our AI-driven, step-by-step assistance
Get Started
Calculus
Authors: Jon Rogawski, Colin Adams
3rd Edition
1319116442, 9781319116446