Question
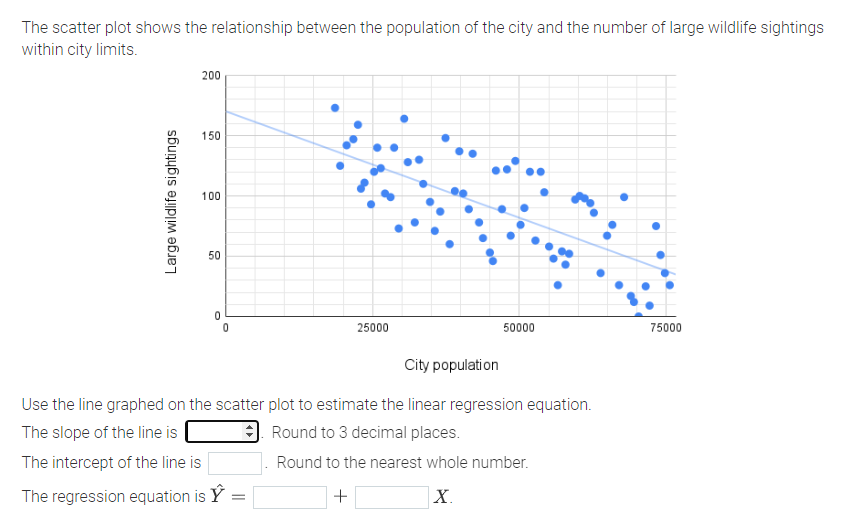
The scatter plot shows the relationship between the population of the city and the number of large wildlife sightings within city limits. Large wildlife

The scatter plot shows the relationship between the population of the city and the number of large wildlife sightings within city limits. Large wildlife sightings 200 150 100 50 0 0 25000 City population 50000 75000 Use the line graphed on the scatter plot to estimate the linear regression equation. The slope of the line is The intercept of the line is The regression equation is : = Round to 3 decimal places. Round to the nearest whole number. + X.
Step by Step Solution
There are 3 Steps involved in it
Step: 1

Get Instant Access to Expert-Tailored Solutions
See step-by-step solutions with expert insights and AI powered tools for academic success
Step: 2

Step: 3

Ace Your Homework with AI
Get the answers you need in no time with our AI-driven, step-by-step assistance
Get StartedRecommended Textbook for
The Princeton Review AP Biology Premium Prep 2023
Authors: The Princeton Review
2023 Edition
0593450655, 978-0593450659
Students also viewed these Mathematics questions
Question
Answered: 1 week ago
Question
Answered: 1 week ago
Question
Answered: 1 week ago
Question
Answered: 1 week ago
Question
Answered: 1 week ago
Question
Answered: 1 week ago
Question
Answered: 1 week ago
Question
Answered: 1 week ago
Question
Answered: 1 week ago
Question
Answered: 1 week ago
Question
Answered: 1 week ago
Question
Answered: 1 week ago
Question
Answered: 1 week ago
Question
Answered: 1 week ago
Question
Answered: 1 week ago
Question
Answered: 1 week ago
Question
Answered: 1 week ago
Question
Answered: 1 week ago
Question
Answered: 1 week ago
Question
Answered: 1 week ago
Question
Answered: 1 week ago
Question
Answered: 1 week ago
View Answer in SolutionInn App


