

Answered step by step
Verified Expert Solution
Question
1 Approved Answer
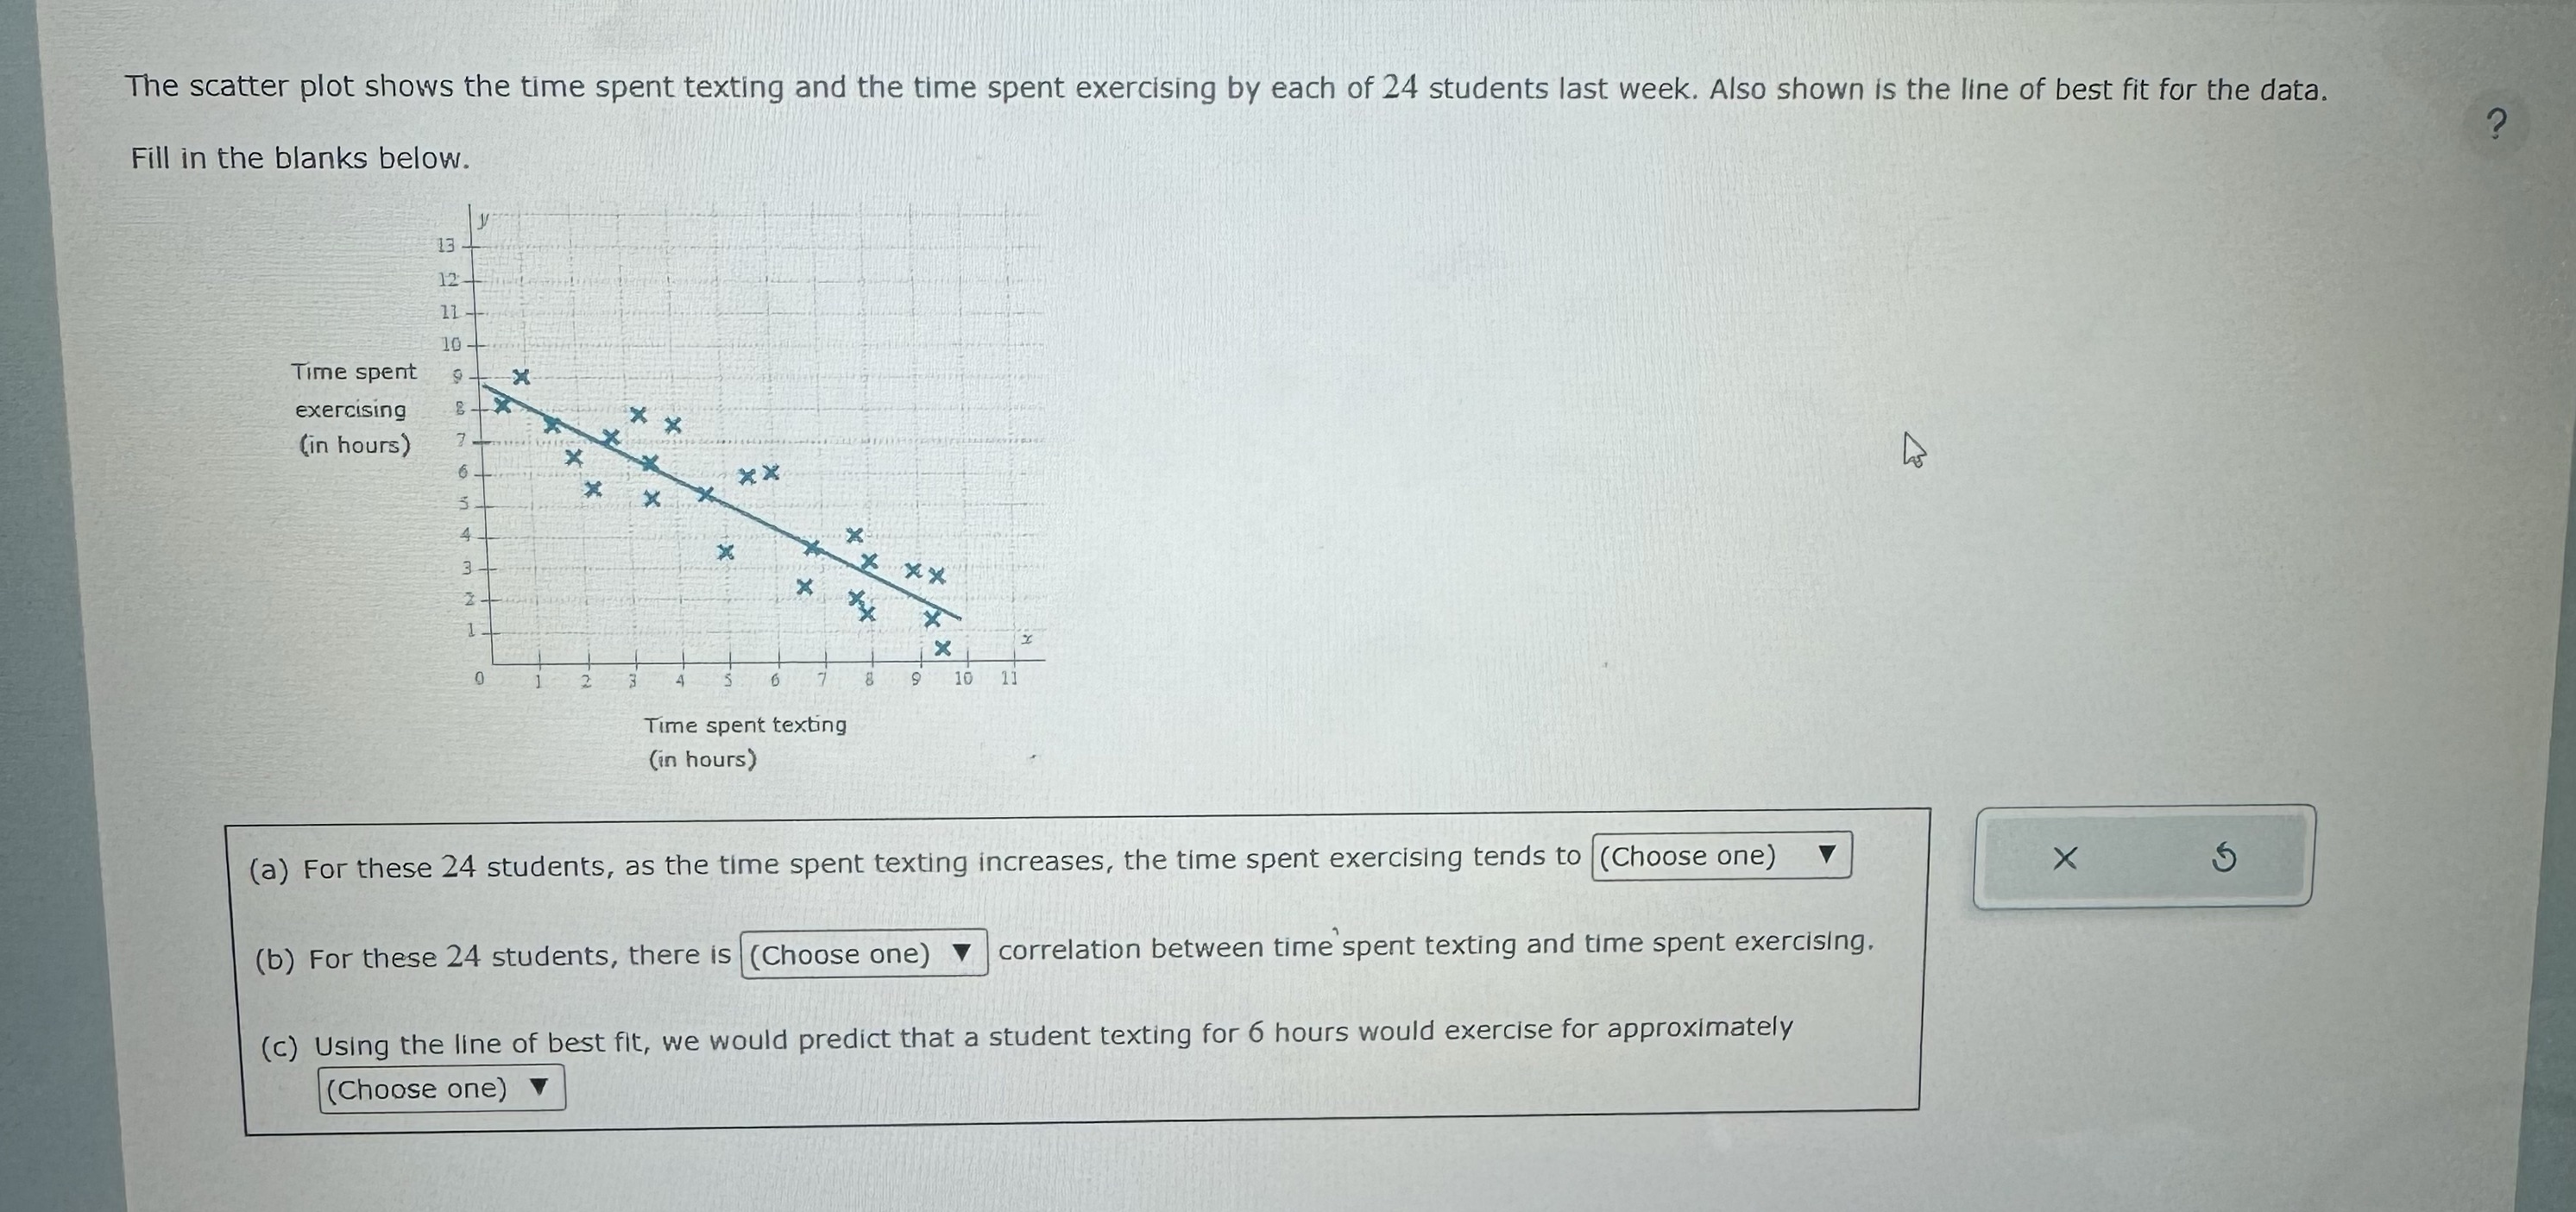
The scatter plot shows the time spent texting and the time spent exercising by each of 24 students last week. Also shown is the line
Step by Step Solution
There are 3 Steps involved in it
Step: 1

Get Instant Access to Expert-Tailored Solutions
See step-by-step solutions with expert insights and AI powered tools for academic success
Step: 2

Step: 3
Ace Your Homework with AI
Get the answers you need in no time with our AI-driven, step-by-step assistance
Get Started
Precalculus
Authors: Michael Sullivan
9th edition
321716835, 321716833, 978-0321716835