

Answered step by step
Verified Expert Solution
Question
1 Approved Answer
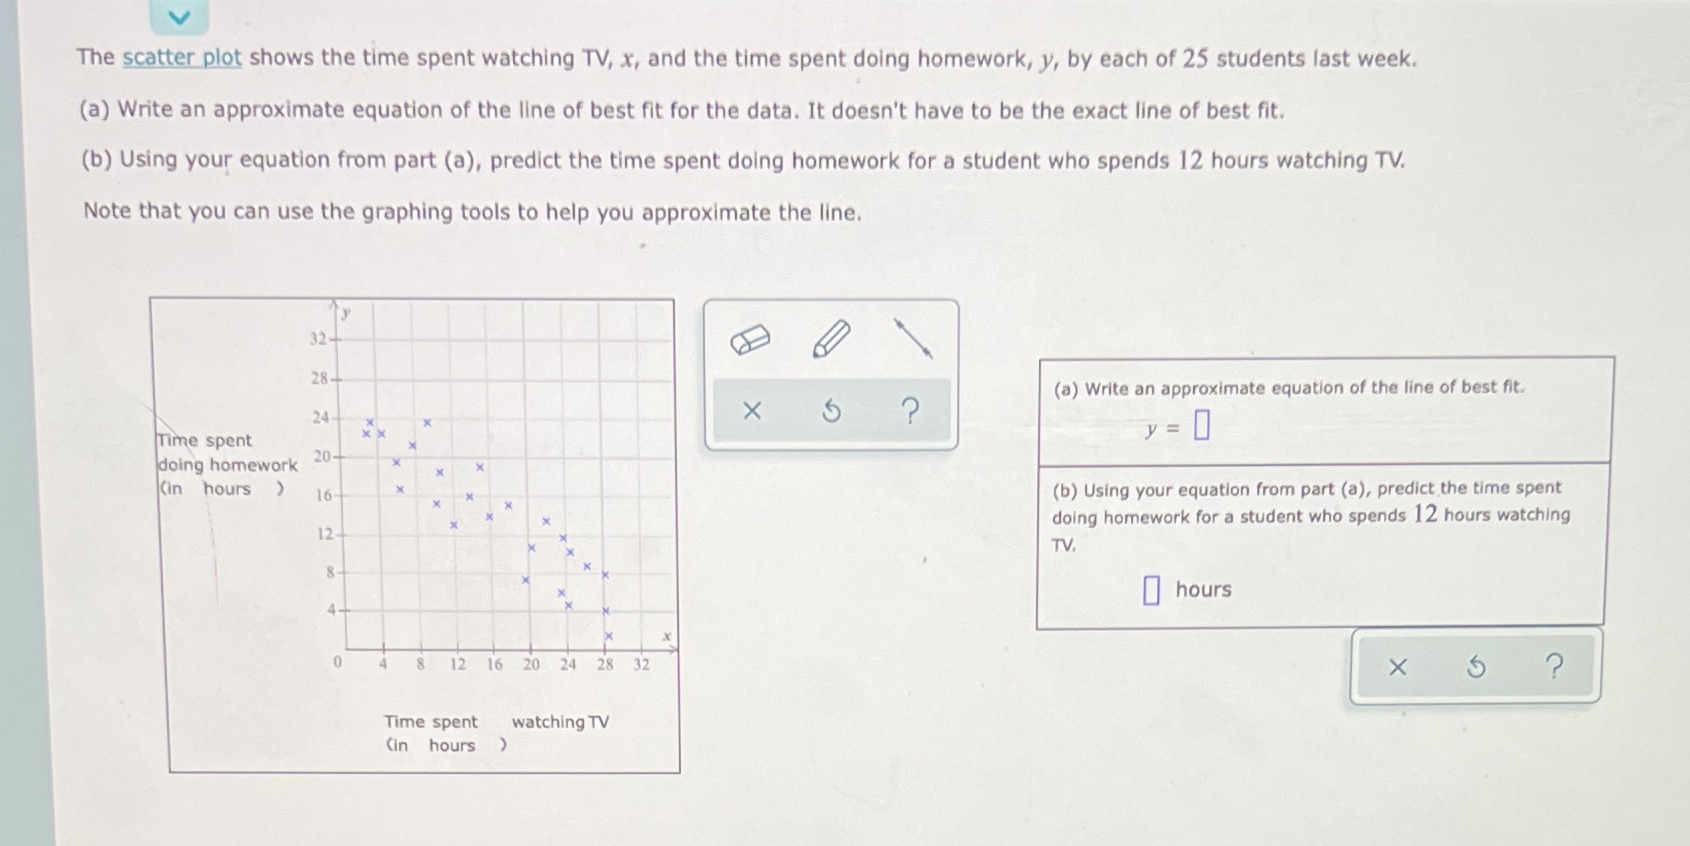
The scatter plot shows the time spent watching TV, x, and the time spent doing homework, y, by each of 25 students last week. (a)
Step by Step Solution
There are 3 Steps involved in it
Step: 1

Get Instant Access to Expert-Tailored Solutions
See step-by-step solutions with expert insights and AI powered tools for academic success
Step: 2

Step: 3
Ace Your Homework with AI
Get the answers you need in no time with our AI-driven, step-by-step assistance
Get Started
Recent Developments Of Mathematical Fluid Mechanics
Authors: Herbert Amann, Yoshikazu Giga, Hideo Kozono, Hisashi Okamoto, Masao Yamazaki
1st Edition
3034809395, 9783034809399