

Answered step by step
Verified Expert Solution
Question
1 Approved Answer
the scatter plot to describe whether or not the variables appear to be related. A 100- Ay 80- 60- 40- 20 O 0 20
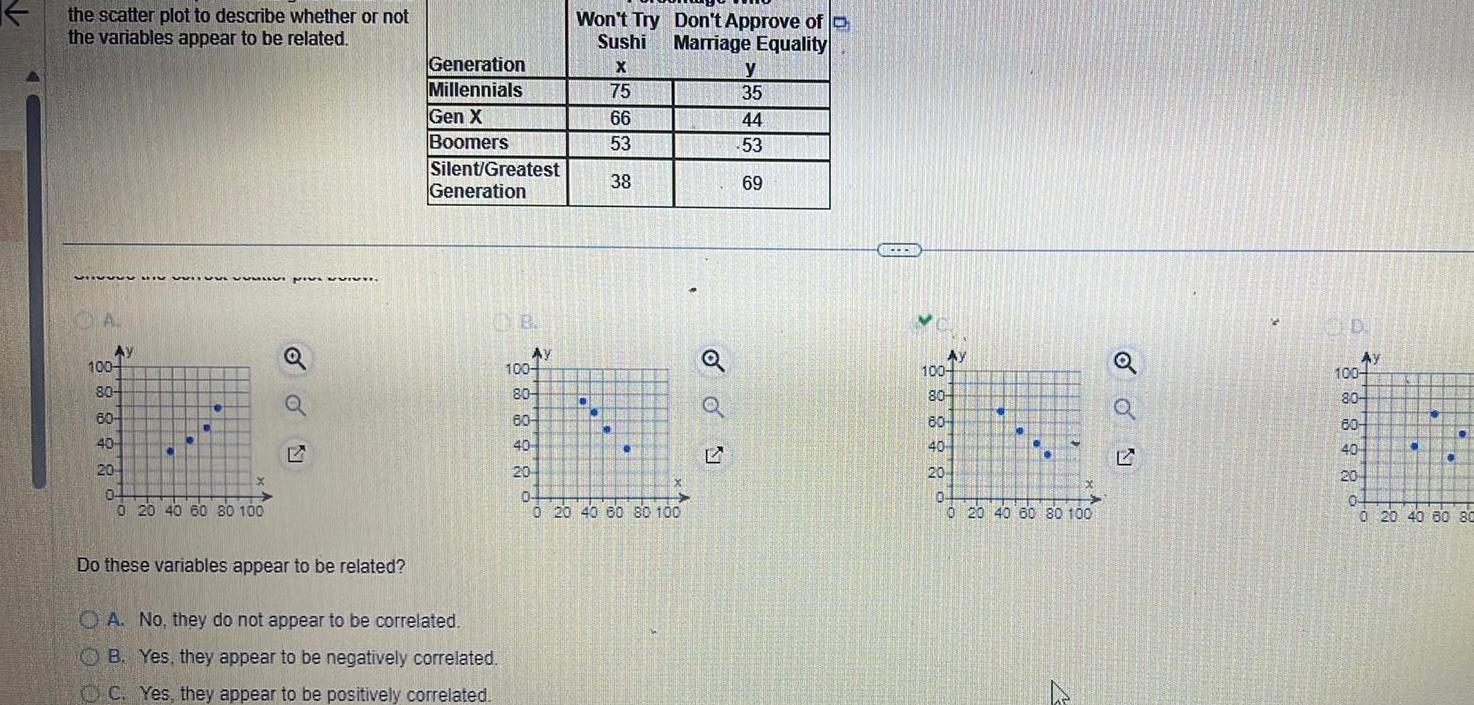
the scatter plot to describe whether or not the variables appear to be related. A 100- Ay 80- 60- 40- 20 O 0 20 40 60 80 100 Won't Try Don't Approve of Sushi Marriage Equality Generation X y Millennials 75 35 Gen X 66 44 Boomers 53 53 Silent/Greatest 38 69 Generation B. AY 100- Ay 100- 80- 80- Q 60- 80- 40- 40 Do these variables appear to be related? OA. No, they do not appear to be correlated. OB. Yes, they appear to be negatively correlated. C. Yes, they appear to be positively correlated. 20 0+ 0 20 40 60 80 100 20 0- 0 20 40 60 80 100 D. Ay 100- 80- 60- 40 20 04 0 20 40 60 80
Step by Step Solution
There are 3 Steps involved in it
Step: 1

Get Instant Access to Expert-Tailored Solutions
See step-by-step solutions with expert insights and AI powered tools for academic success
Step: 2

Step: 3
Ace Your Homework with AI
Get the answers you need in no time with our AI-driven, step-by-step assistance
Get Started
Quantitative Methods For Business Management And Finance
Authors: Louise Swift, Sally Piff
2nd Edition
1403935289, 9781403935281