Answered step by step
Verified Expert Solution
Question
1 Approved Answer
The second question please Standard Trade Model. Assume that two countries are identical in everything (same technology, same typc and level of endowments, etc...) except

The second question please
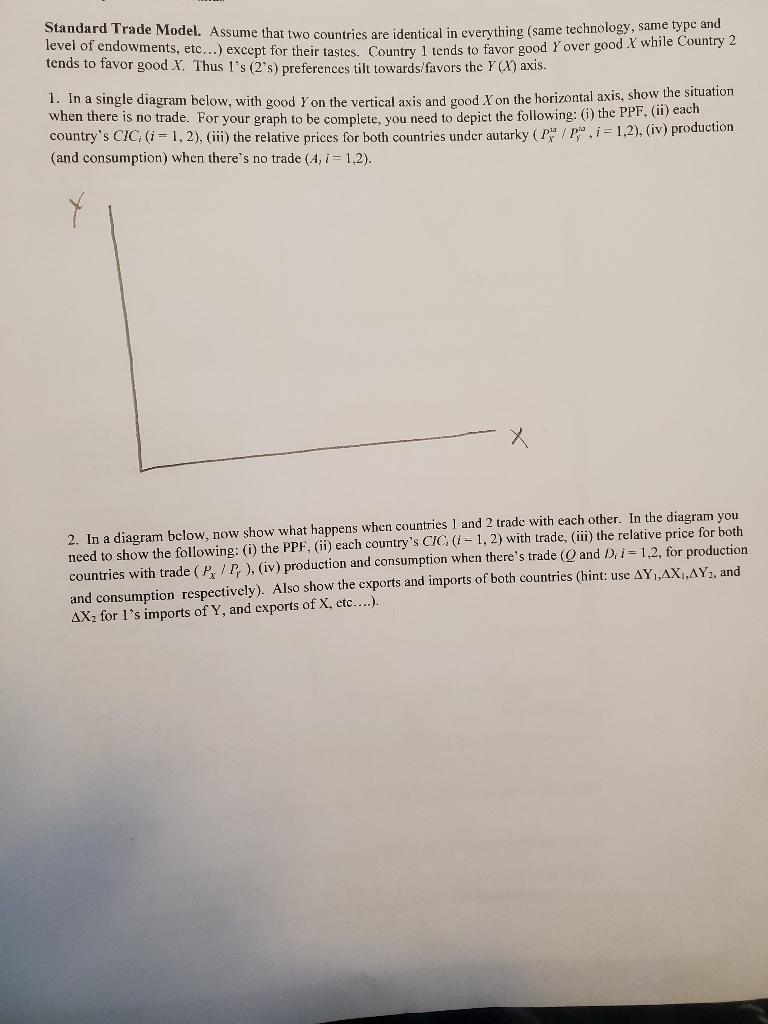
Standard Trade Model. Assume that two countries are identical in everything (same technology, same typc and level of endowments, etc...) except for their tastes. Country 1 tends to favor good Y over good X while Country 2 tends to favor good X. Thus 1 's (2's) preferences tilt towards/favors the Y(X) axis. 1. In a single diagram below, with good Y on the vertical axis and good X on the horizontal axis, show the situation when there is no trade. For your graph to be complete, you need to depict the following: (i) the PPF, (ii) each country's CICi(i=1,2), (iii) the relative prices for both countries under autarky (Px1a/PYia,i=1,2), (iv) production (and consumption) when there's no trade (A,i=1,2). 2. In a diagram below, now show what happens when countries 1 and 2 trade with each other. In the diagram you need to show the following: (i) the PPF, (ii) each country's CIC(i1,2) with trade, (iii) the relative price for both countries with trade (PX/Pr), (iv) production and consumption when there's trade (Q and Dii=1,2, for production and consumption respectively). Also show the cxports and imports of both countries (hint: use Y1,X1,Y2, and X2 for 1 's imports of Y, and exports of X, etc....). Standard Trade Model. Assume that two countries are identical in everything (same technology, same typc and level of endowments, etc...) except for their tastes. Country 1 tends to favor good Y over good X while Country 2 tends to favor good X. Thus 1 's (2's) preferences tilt towards/favors the Y(X) axis. 1. In a single diagram below, with good Y on the vertical axis and good X on the horizontal axis, show the situation when there is no trade. For your graph to be complete, you need to depict the following: (i) the PPF, (ii) each country's CICi(i=1,2), (iii) the relative prices for both countries under autarky (Px1a/PYia,i=1,2), (iv) production (and consumption) when there's no trade (A,i=1,2). 2. In a diagram below, now show what happens when countries 1 and 2 trade with each other. In the diagram you need to show the following: (i) the PPF, (ii) each country's CIC(i1,2) with trade, (iii) the relative price for both countries with trade (PX/Pr), (iv) production and consumption when there's trade (Q and Dii=1,2, for production and consumption respectively). Also show the cxports and imports of both countries (hint: use Y1,X1,Y2, and X2 for 1 's imports of Y, and exports of X, etc....)
Step by Step Solution
There are 3 Steps involved in it
Step: 1

Get Instant Access to Expert-Tailored Solutions
See step-by-step solutions with expert insights and AI powered tools for academic success
Step: 2

Step: 3

Ace Your Homework with AI
Get the answers you need in no time with our AI-driven, step-by-step assistance
Get Started


