

Answered step by step
Verified Expert Solution
Question
1 Approved Answer
The shaded region between the graphs of y = and y = 3x 15 is displayed below in orange. - 6 X 11- -40
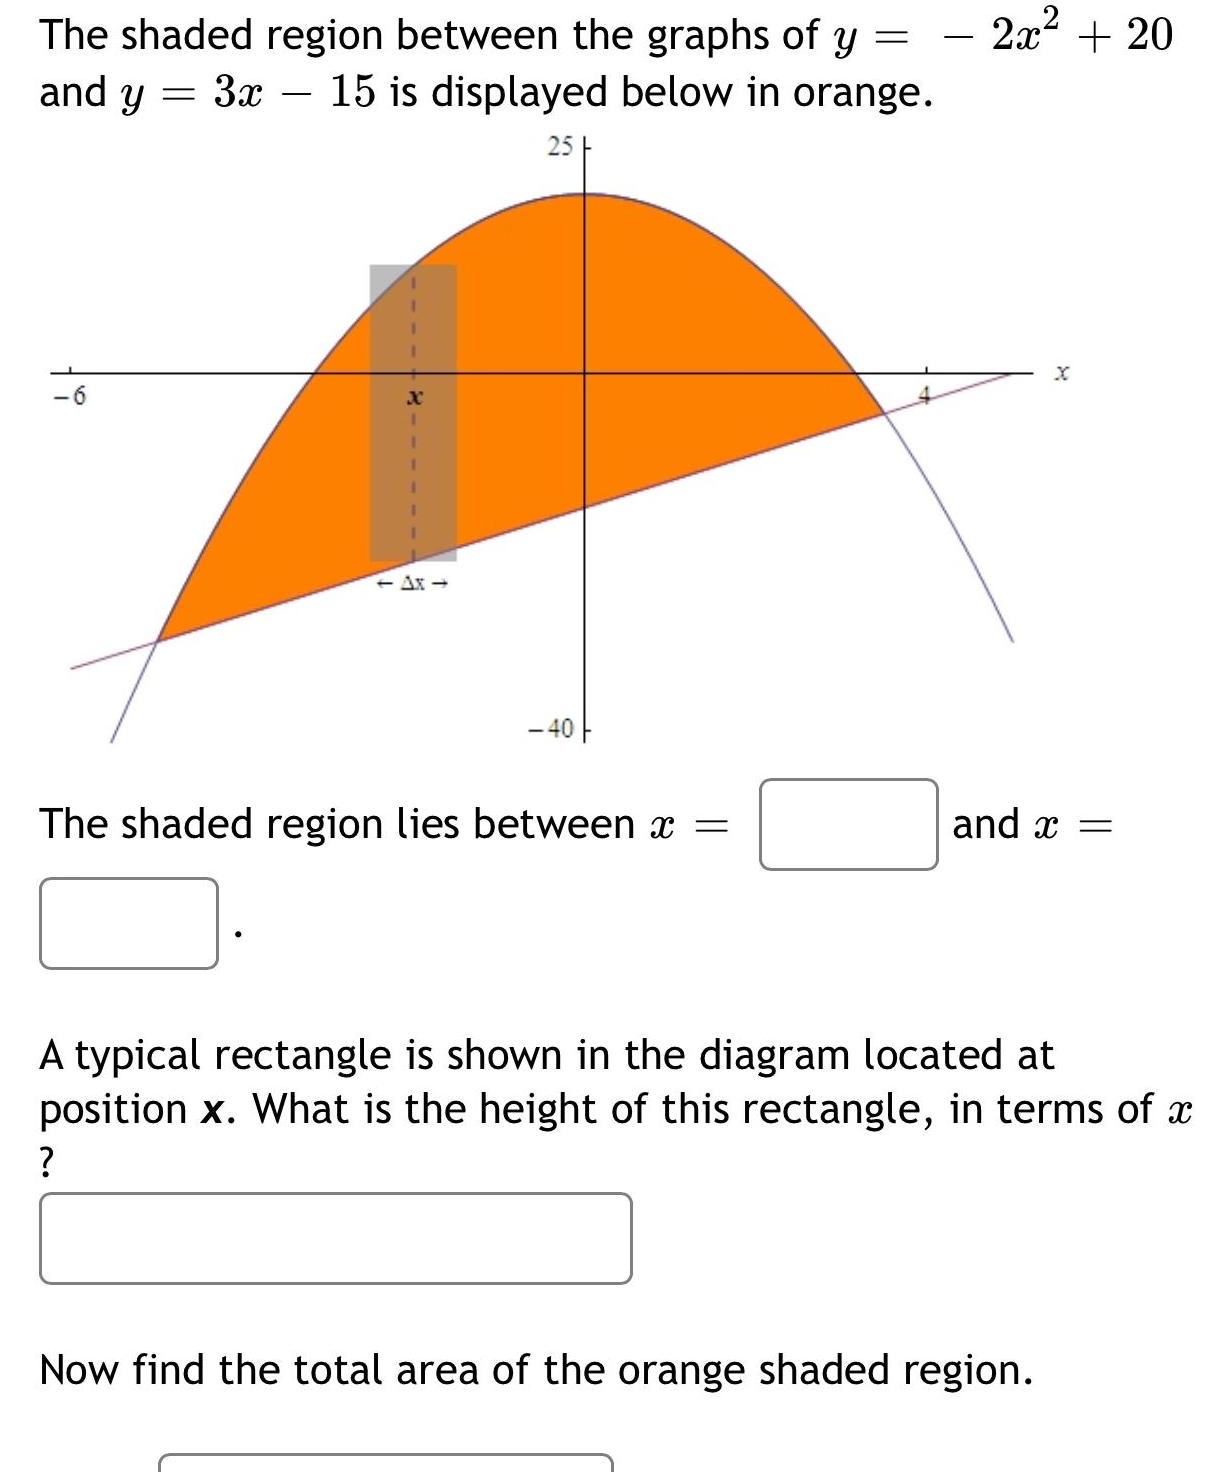
The shaded region between the graphs of y = and y = 3x 15 is displayed below in orange. - 6 X 11- -40 The shaded region lies between x = - 2x + 20 X and x = A typical rectangle is shown in the diagram located at position x. What is the height of this rectangle, in terms of x ? Now find the total area of the orange shaded region.
Step by Step Solution
There are 3 Steps involved in it
Step: 1

Get Instant Access to Expert-Tailored Solutions
See step-by-step solutions with expert insights and AI powered tools for academic success
Step: 2

Step: 3
Ace Your Homework with AI
Get the answers you need in no time with our AI-driven, step-by-step assistance
Get Started
Statistical Methods For The Social Sciences
Authors: Alan Agresti
5th Edition
013450710X, 978-0134507101