Question
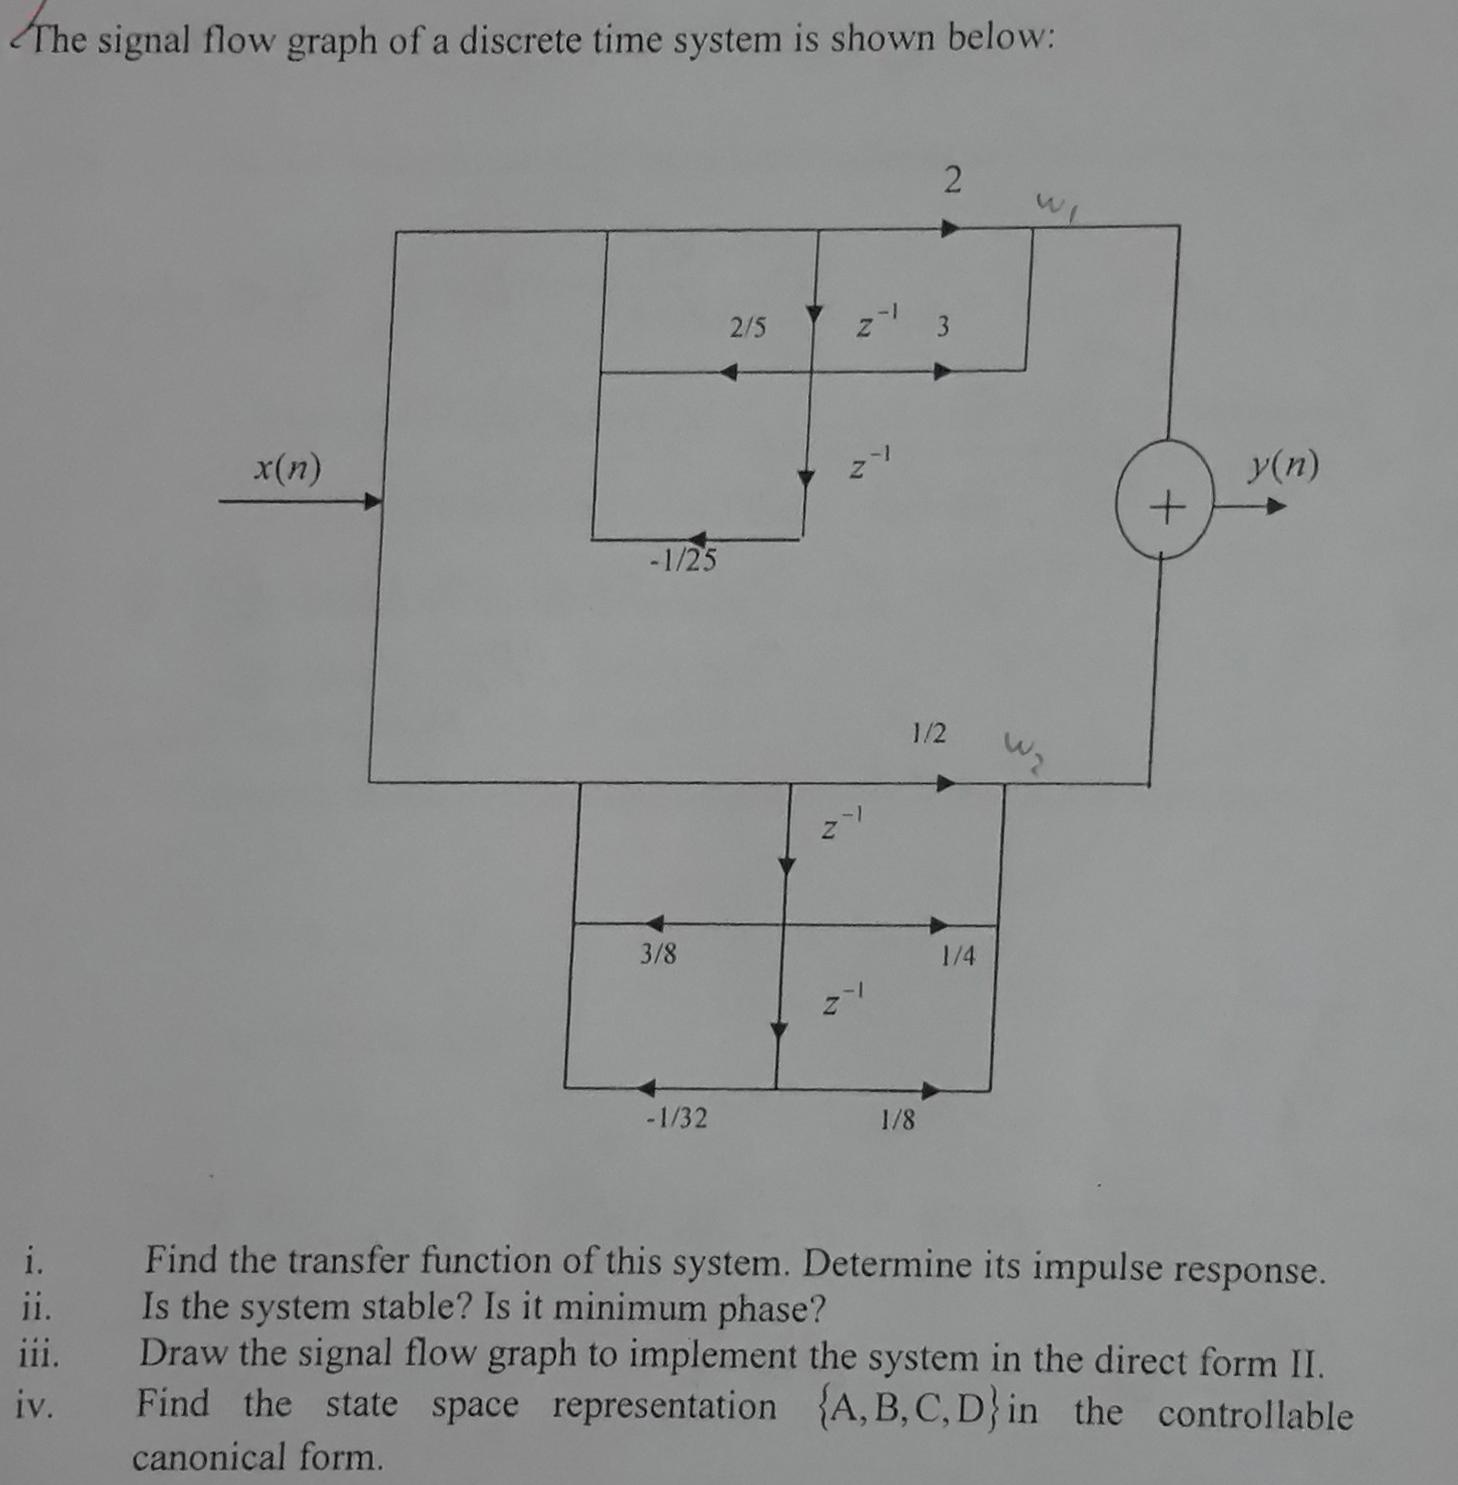
The signal flow graph of a discrete time system is shown below: i. iii. iv. x(n) -1/25 3/8 -1/32 2/5 -1 Z- 3 2-1

The signal flow graph of a discrete time system is shown below: i. iii. iv. x(n) -1/25 3/8 -1/32 2/5 -1 Z- 3 2-1 -1 2 1/2 1/8 1/4 WI W + y(n) Find the transfer function of this system. Determine its impulse response. Is the system stable? Is it minimum phase? Draw the signal flow graph to implement the system in the direct form II. Find the state space representation (A, B, C, D} in the controllable canonical form.
Step by Step Solution
3.40 Rating (144 Votes )
There are 3 Steps involved in it
Step: 1
i To find the transfer function we write the relationships b...
Get Instant Access to Expert-Tailored Solutions
See step-by-step solutions with expert insights and AI powered tools for academic success
Step: 2

Step: 3

Ace Your Homework with AI
Get the answers you need in no time with our AI-driven, step-by-step assistance
Get StartedRecommended Textbook for
Income Tax Fundamentals 2013
Authors: Gerald E. Whittenburg, Martha Altus Buller, Steven L Gill
31st Edition
1111972516, 978-1285586618, 1285586611, 978-1285613109, 978-1111972516
Students also viewed these Accounting questions
Question
Answered: 1 week ago
Question
Answered: 1 week ago
Question
Answered: 1 week ago
Question
Answered: 1 week ago
Question
Answered: 1 week ago
Question
Answered: 1 week ago
Question
Answered: 1 week ago
Question
Answered: 1 week ago
Question
Answered: 1 week ago
Question
Answered: 1 week ago
Question
Answered: 1 week ago
Question
Answered: 1 week ago
Question
Answered: 1 week ago
Question
Answered: 1 week ago
Question
Answered: 1 week ago
Question
Answered: 1 week ago
Question
Answered: 1 week ago
Question
Answered: 1 week ago
Question
Answered: 1 week ago
Question
Answered: 1 week ago
Question
Answered: 1 week ago
View Answer in SolutionInn App


