

Question
The similarities are that all the graphs start at a. 1000 b. 0 c. 1 and show A a. increasing b. decreasing as t a.
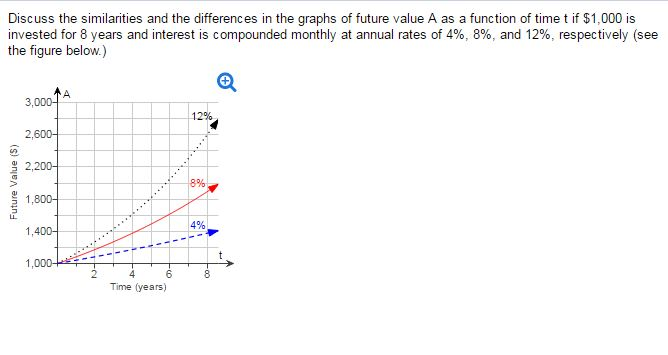
The similarities are that all the graphs start at a. 1000 b. 0 c. 1 and show A a. increasing b. decreasing as t a. increases b. decreases. The difference is the rate at which the values of A a. increase b. decrease which depends on the value of the a. annual rate b. investment.
Step by Step Solution
There are 3 Steps involved in it
Step: 1

Get Instant Access to Expert-Tailored Solutions
See step-by-step solutions with expert insights and AI powered tools for academic success
Step: 2

Step: 3
Ace Your Homework with AI
Get the answers you need in no time with our AI-driven, step-by-step assistance
Get Started
Finance At The Threshold
Authors: Christopher Houghton Budd
1st Edition
0566092115, 978-0566092114