

Answered step by step
Verified Expert Solution
Question
1 Approved Answer
The spreadsheet below contains the total returns for the S&P 500 Index for the years 2000-2009 in decimal form. This 10-year period has been
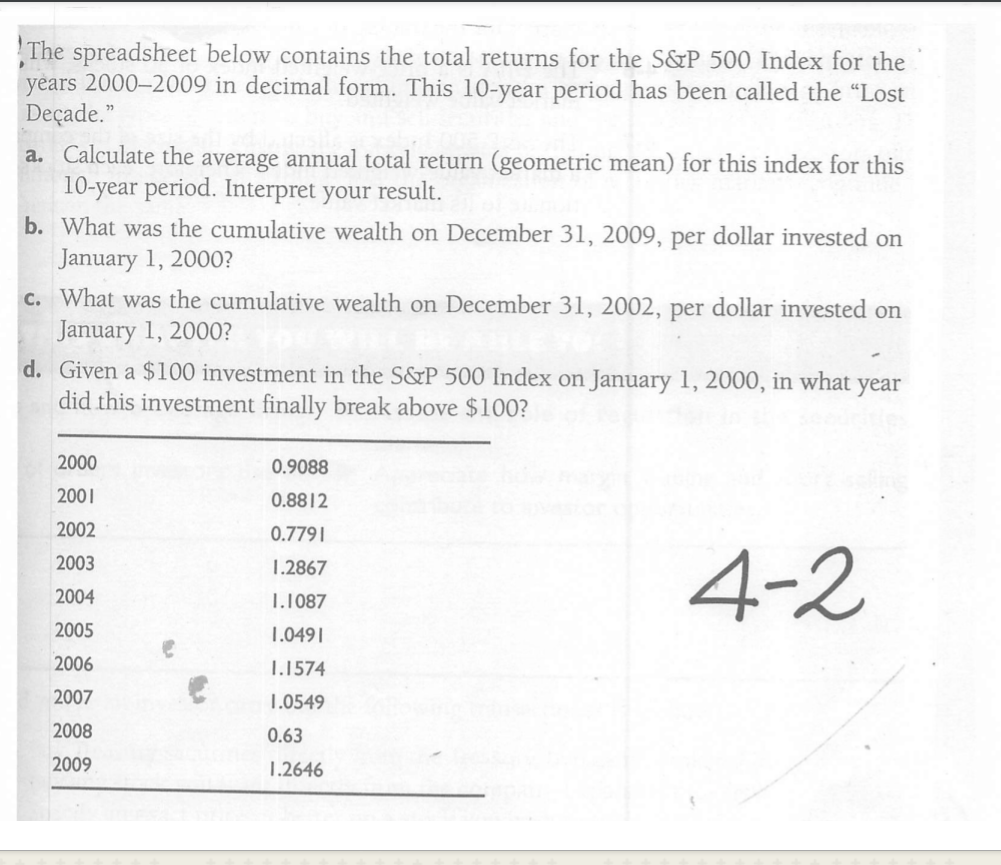
The spreadsheet below contains the total returns for the S&P 500 Index for the years 2000-2009 in decimal form. This 10-year period has been called the "Lost Decade." a. Calculate the average annual total return (geometric mean) for this index for this 10-year period. Interpret your result. b. What was the cumulative wealth on December 31, 2009, per dollar invested on January 1, 2000? c. What was the cumulative wealth on December 31, 2002, per dollar invested on January 1, 2000? d. Given a $100 investment in the S&P 500 Index on January 1, 2000, in what year did this investment finally break above $100? 2000 2001 0.9088 0.8812 2002 0.7791 2003 1.2867 2004 1.1087 2005 1.0491 2006 1.1574 2007 1.0549 2008 0.63 2009 1.2646 4-2
Step by Step Solution
There are 3 Steps involved in it
Step: 1

Get Instant Access to Expert-Tailored Solutions
See step-by-step solutions with expert insights and AI powered tools for academic success
Step: 2

Step: 3
Ace Your Homework with AI
Get the answers you need in no time with our AI-driven, step-by-step assistance
Get Started
Venture capital and the finance of innovation
Authors: Andrew Metrick
2nd Edition
9781118137888, 470454709, 1118137884, 978-0470454701