

Answered step by step
Verified Expert Solution
Question
1 Approved Answer
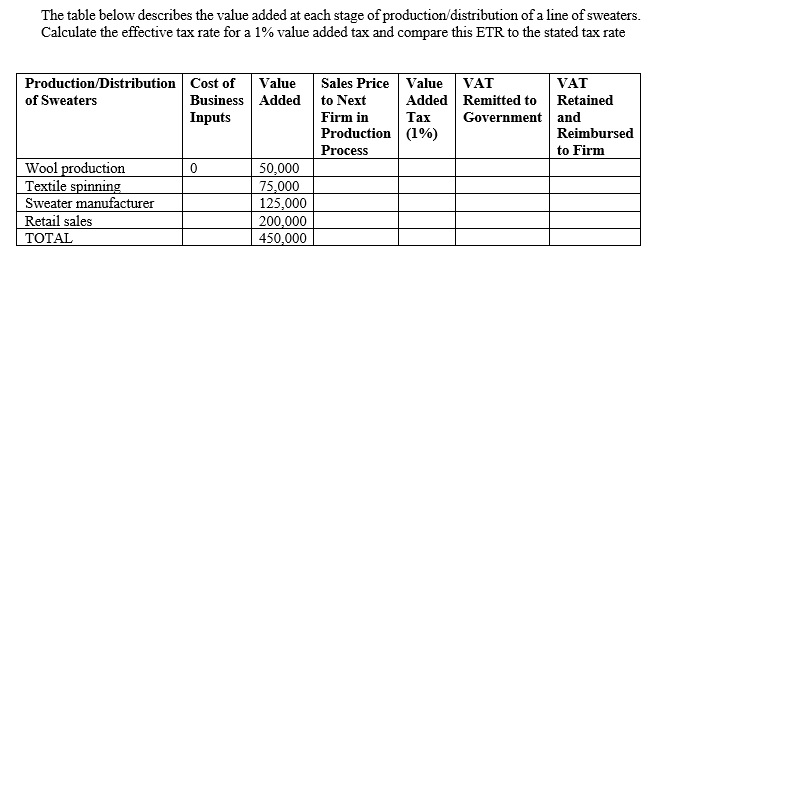
The table below describes the value added at each stage of production distribution of a line of sweaters. Calculate the effective tax rate for a
Step by Step Solution
There are 3 Steps involved in it
Step: 1

Get Instant Access to Expert-Tailored Solutions
See step-by-step solutions with expert insights and AI powered tools for academic success
Step: 2

Step: 3
Ace Your Homework with AI
Get the answers you need in no time with our AI-driven, step-by-step assistance
Get Started
The Fundamental Principles Of Finance
Authors: Robert Irons
1st Edition
1138477524, 9781138477520