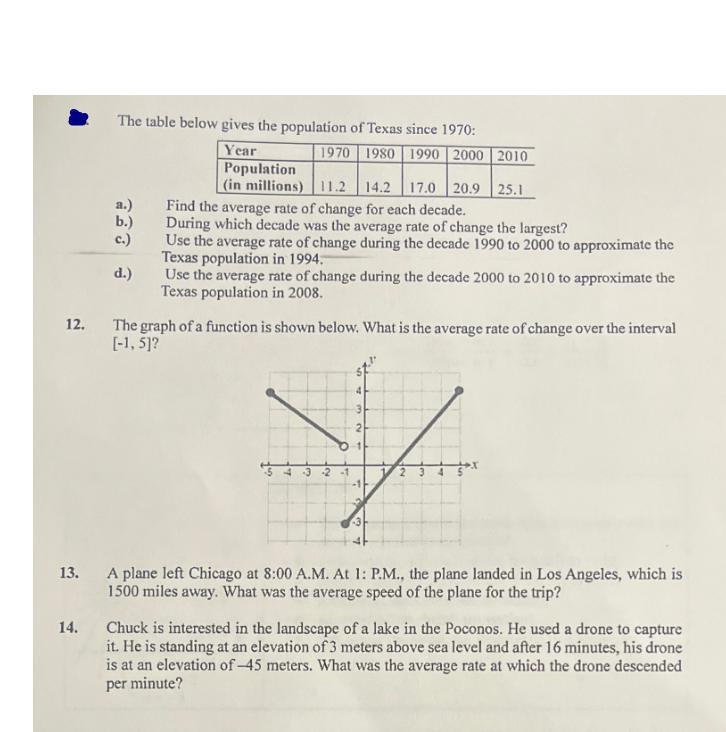
The table below gives the population of Texas since 1970: 933 a.) b.) c.) d.) Year Population 1970 1980 1990 2000 2010 (in millions)

The table below gives the population of Texas since 1970: 933 a.) b.) c.) d.) Year Population 1970 1980 1990 2000 2010 (in millions) 11.2 14.2 17.0 20.9 25.1 Find the average rate of change for each decade. During which decade was the average rate of change the largest? Use the average rate of change during the decade 1990 to 2000 to approximate the Texas population in 1994. Use the average rate of change during the decade 2000 to 2010 to approximate the Texas population in 2008. 12. The graph of a function is shown below. What is the average rate of change over the interval [-1,5]? 32-1 2 13. A plane left Chicago at 8:00 A.M. At 1: P.M., the plane landed in Los Angeles, which is 1500 miles away. What was the average speed of the plane for the trip? 14. Chuck is interested in the landscape of a lake in the Poconos. He used a drone to capture it. He is standing at an elevation of 3 meters above sea level and after 16 minutes, his drone is at an elevation of-45 meters. What was the average rate at which the drone descended per minute?
Step by Step Solution
There are 3 Steps involved in it
Step: 1

See step-by-step solutions with expert insights and AI powered tools for academic success
Step: 2

Step: 3

Ace Your Homework with AI
Get the answers you need in no time with our AI-driven, step-by-step assistance
Get Started


