The table below lists the frequency of wins for different post positions in a horse race. A post position of 1 is closest to the
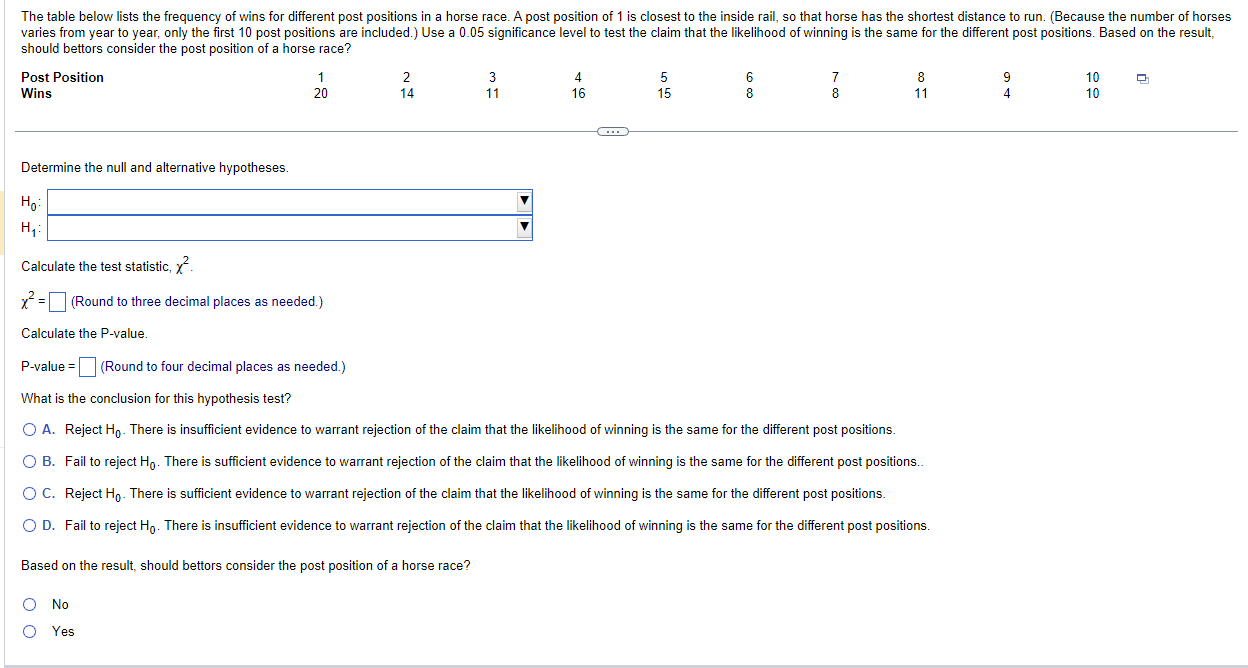
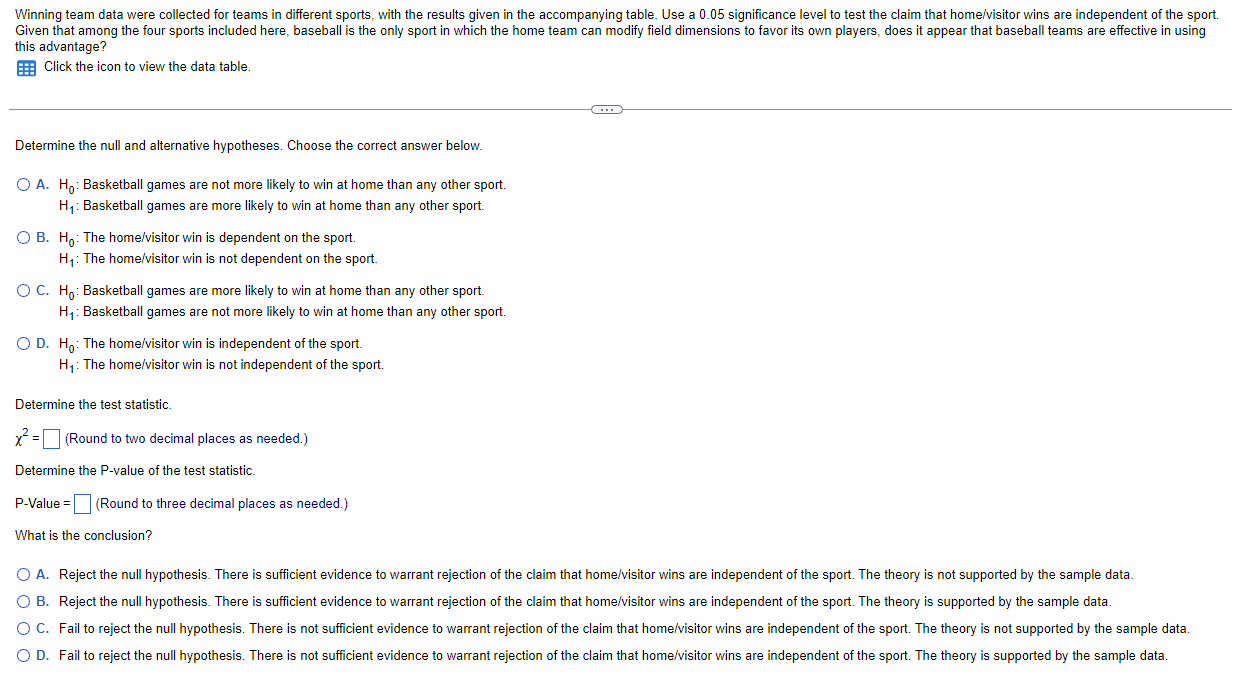
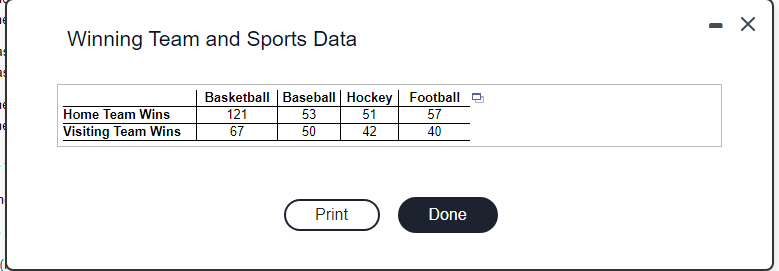
The table below lists the frequency of wins for different post positions in a horse race. A post position of 1 is closest to the inside rail, so that horse has the shortest distance to run. (Because the number of horses varies from year to year, only the first 10 post positions are included.) Use a 0.05 significance level to test the claim that the likelihood of winning is the same for the different post positions. Based on the result, should bettors consider the post position of a horse race? Paost Position 1 2 3 4 5 6 7 & 9 10 o Wins 20 14 11 16 15 8 4 10 Determine the null and alternative hypotheses Hy 7 Hy: = Calculate the test statistic, /2 )(2 = (Round to three decimal places as needed.) Calculate the P-value. P-value=| |(Round to four decimal places as neaded.) What is the conclusion for this hypothesis test? () A, Reject Hy. There is insufficient evidence to warrant rejection of the claim that the likelihood of winning is the same for the different post positions. () B. Fail to reject Hy. There is sufficient evidence to warrant rejection of the claim that the likelihood of winning is the same for the different post positions () C. Reject Hy. There is sufficient evidence to warrant rejection of the claim that the likelihood of winning is the same for the different post pesitions. (O D. Fail to reject Hy. There is insufficient evidence to warrant rejection of the claim that the likelihood of winning is the same for the different post positions Based on the result, should bettors consider the post position of a horse race? ) No O Yes Winning team data were collected for teams in different sports, with the results given in the accompanying table. Use a 0.05 significance level to test the claim that home/visitor wins are independent of the sport. Given that among the four sports included here, baseball is the only sport in which the home team can modify field dimensions to favor its own players, does it appear that baseball teams are effective in using this advantage? Click the icon to view the data table. Determine the null and alternative hypotheses. Choose the correct answer below. O A. Ho: Basketball games are not more likely to win at home than any other sport. Hy: Basketball games are more likely to win at home than any other sport. O B. Ho: The home/visitor win is dependent on the sport. Hy: The home/visitor win is not dependent on the sport. O C. Ho: Basketball games are more likely to win at home than any other sport. Hy : Basketball games are not more likely to win at home than any other sport. O D. Ho: The home/visitor win is independent of the sport. Hy: The home/visitor win is not independent of the sport. Determine the test statistic. x2 = (Round to two decimal places as needed.) Determine the P-value of the test statistic. P-Value = (Round to three decimal places as needed.) What is the conclusion? O A. Reject the null hypothesis. There is sufficient evidence to warrant rejection of the claim that home/visitor wins are independent of the sport. The theory is not supported by the sample data. O B. Reject the null hypothesis. There is sufficient evidence to warrant rejection of the claim that home/visitor wins are independent of the sport. The theory is supported by the sample data. O C. Fail to reject the null hypothesis. There is not sufficient evidence to warrant rejection of the claim that home/visitor wins are independent of the sport. The theory is not supported by the sample data. O D. Fail to reject the null hypothesis. There is not sufficient evidence to warrant rejection of the claim that home/visitor wins are independent of the sport. The theory is supported by the sample data.Winning Team and Sports Data Basketball | Baseball | Hockey | Football O Home Team Wins Visiting Team Wins
Step by Step Solution
There are 3 Steps involved in it
Step: 1
Get Instant Access to Expert-Tailored Solutions
See step-by-step solutions with expert insights and AI powered tools for academic success
Step: 2
Step: 3
Ace Your Homework with AI
Get the answers you need in no time with our AI-driven, step-by-step assistance