

Question
The table below presents the returns on stocks ABC and XYZ for a five-year period. a. Assume that the average returns from the data equals
The table below presents the returns on stocks ABC and XYZ for a five-year period.
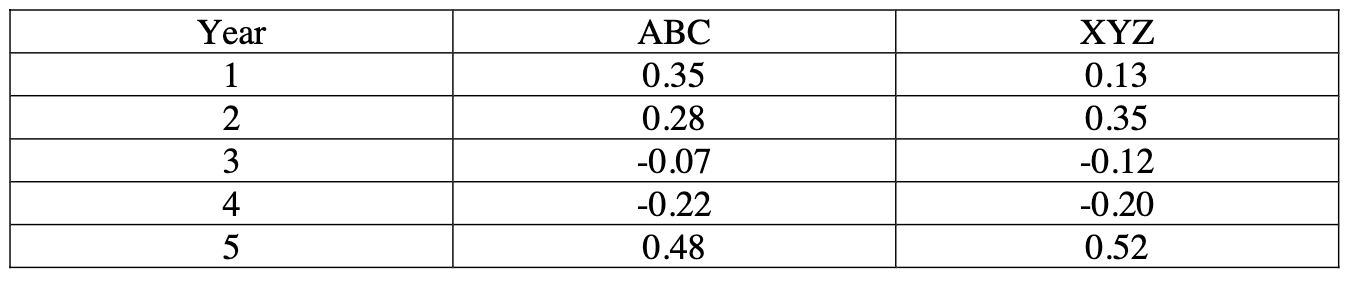
a. Assume that the average returns from the data equals the expected returns for the respective stocks. If you want to form a portfolio with expected returns of 15%, what proportion of your assets would you invest in each of these stocks?
b. What is the standard deviation of this portfolio?
c. Suppose the risk-free rate is 5%. Compute the slope of the capital allocation lines for ABC and XYZ. Which of these two stocks yields a higher reward-to-risk ratio?
d. Your boss claims that you should invest only in the stock with the higher reward- to-risk ratio, and never invest in the stock with the lower reward-to-risk ratio. Do you agree? Explain.
\begin{tabular}{|c|c|c|} \hline Year & ABC & XYZ \\ \hline 1 & 0.35 & 0.13 \\ \hline 2 & 0.28 & 0.35 \\ \hline 3 & -0.07 & -0.12 \\ \hline 4 & -0.22 & -0.20 \\ \hline 5 & 0.48 & 0.52 \\ \hline \end{tabular}Step by Step Solution
There are 3 Steps involved in it
Step: 1

Get Instant Access to Expert-Tailored Solutions
See step-by-step solutions with expert insights and AI powered tools for academic success
Step: 2

Step: 3
Ace Your Homework with AI
Get the answers you need in no time with our AI-driven, step-by-step assistance
Get Started
The Business Credit Handbook
Authors: Mr. Reid A. Nunn
1st Edition
1500542725, 978-1500542726