

Question
The table below provides information for the demand and supply of bacon cheeseburgers Price 24 20 16 12 8 4 1st attempt Price AR ZNR
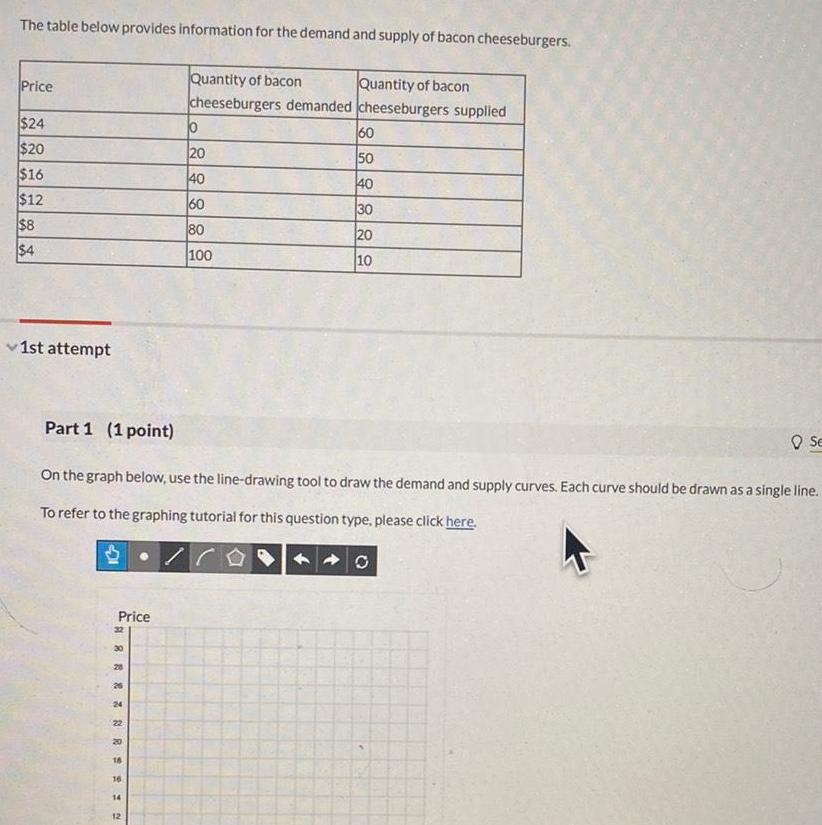

The table below provides information for the demand and supply of bacon cheeseburgers Price 24 20 16 12 8 4 1st attempt Price AR ZNR 2 2 30 Part 1 1 point On the graph below use the line drawing tool to draw the demand and supply curves Each curve should be drawn as a single line To refer to the graphing tutorial for this question type please click here 24 22 16 16 14 Quantity of bacon Quantity of bacon cheeseburgers demanded cheeseburgers supplied 12 0 20 40 60 80 100 60 50 40 30 20 10 O Se
Step by Step Solution
There are 3 Steps involved in it
Step: 1

Get Instant Access to Expert-Tailored Solutions
See step-by-step solutions with expert insights and AI powered tools for academic success
Step: 2

Step: 3
Ace Your Homework with AI
Get the answers you need in no time with our AI-driven, step-by-step assistance
Get Started
Calculus Early Transcendentals, Single Variable
Authors: Jon Rogawski
2nd Edition
1464100535, 9781464100536