

Answered step by step
Verified Expert Solution
Question
1 Approved Answer
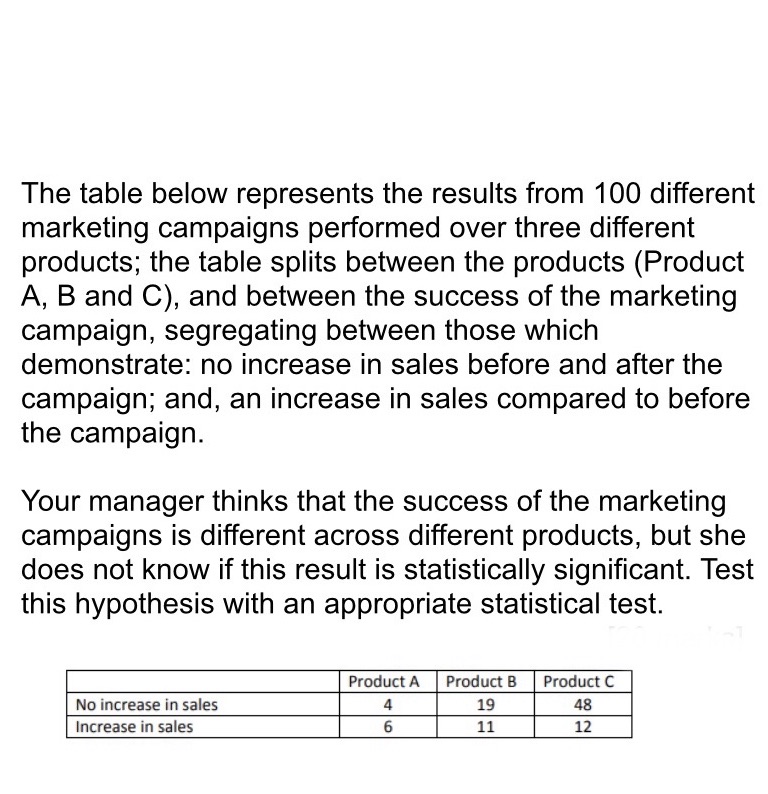
The table below represents the results from 100 different marketing campaigns performed over three different products; the table splits between the products (Product A, B

Step by Step Solution
There are 3 Steps involved in it
Step: 1

Get Instant Access to Expert-Tailored Solutions
See step-by-step solutions with expert insights and AI powered tools for academic success
Step: 2

Step: 3
Ace Your Homework with AI
Get the answers you need in no time with our AI-driven, step-by-step assistance
Get Started
Basic College Mathematics (Subscription)
Authors: Elayn Martin Gay
6th Edition
0134844947, 9780134844947