

Question
The table below show data that has been collected from different fields from various farms in a certain valley The table contains the grams of

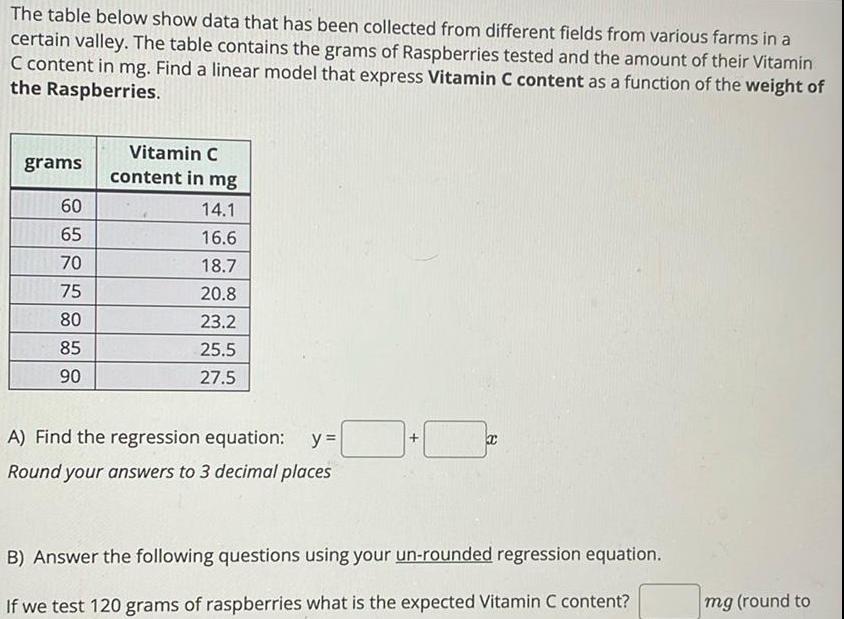
The table below show data that has been collected from different fields from various farms in a certain valley The table contains the grams of Raspberries tested and the amount of their Vitamin C content in mg Find a linear model that express Vitamin C content as a function of the weight of the Raspberries grams 60 65 70 75 80 85 90 Vitamin C content in mg 14 1 16 6 18 7 20 8 23 2 25 5 27 5 A Find the regression equation y Round your answers to 3 decimal places B Answer the following questions using your un rounded regression equation If we test 120 grams of raspberries what is the expected Vitamin C content mg round to
Step by Step Solution
There are 3 Steps involved in it
Step: 1

Get Instant Access to Expert-Tailored Solutions
See step-by-step solutions with expert insights and AI powered tools for academic success
Step: 2

Step: 3
Ace Your Homework with AI
Get the answers you need in no time with our AI-driven, step-by-step assistance
Get Started
Elementary Differential Geometry
Authors: Barrett O'Neill
1st Edition
148326811X, 9781483268118