

Answered step by step
Verified Expert Solution
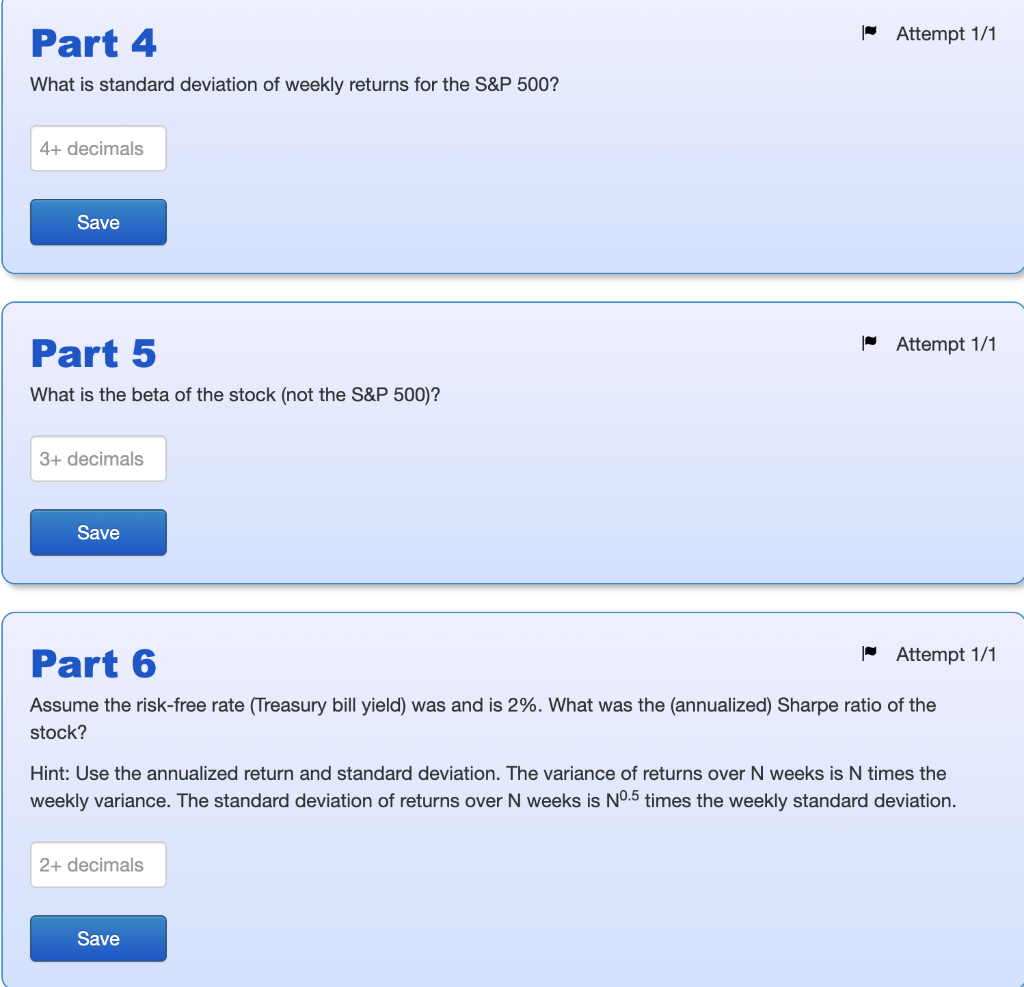
Question
1 Approved Answer
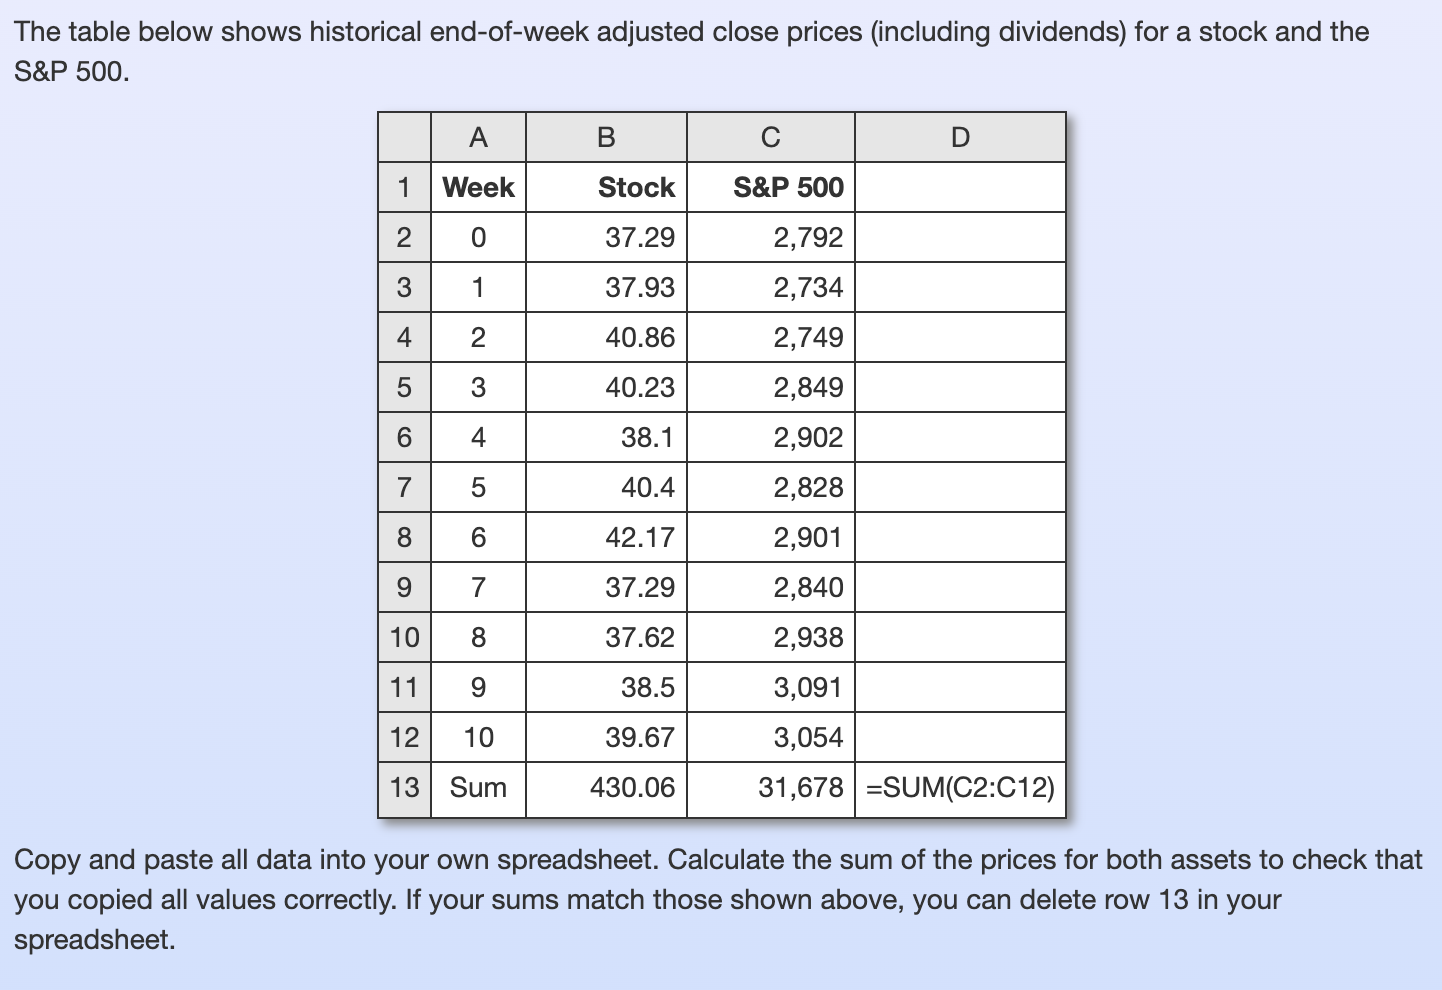
The table below shows historical end-of-week adjusted close prices (including dividends) for a stock and the S&P 500. A B C 1 Week Stock S&P
Step by Step Solution
There are 3 Steps involved in it
Step: 1

Get Instant Access to Expert-Tailored Solutions
See step-by-step solutions with expert insights and AI powered tools for academic success
Step: 2

Step: 3
Ace Your Homework with AI
Get the answers you need in no time with our AI-driven, step-by-step assistance
Get Started
Capital And Finance
Authors: Peter Lewin, Nicolás Cachanosky
1st Edition
0367514559, 978-0367514556