Question
The table below shows Malaysia's gross domestic product (GDP) by aggregate demand from 2014 to 2015. Analyze the results from both years and explains your
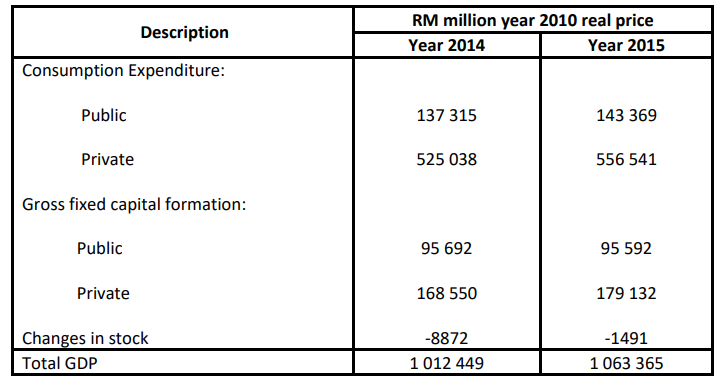
The table below shows Malaysia's gross domestic product (GDP) by aggregate demand from 2014 to 2015.

Analyze the results from both years and explains your observations
Description Consumption Expenditure: Public Private Gross fixed capital formation: Public Private Changes in stock Total GDP RM million year 2010 real price Year 2014 Year 2015 137 315 525 038 95 692 168 550 -8872 1 012 449 143 369 556 541 95 592 179 132 -1491 1 063 365
Step by Step Solution
There are 3 Steps involved in it
Step: 1
Consumption expenditure from the public increased by 6054 Consumption ex...
Get Instant Access to Expert-Tailored Solutions
See step-by-step solutions with expert insights and AI powered tools for academic success
Step: 2

Step: 3

Ace Your Homework with AI
Get the answers you need in no time with our AI-driven, step-by-step assistance
Get StartedRecommended Textbook for
Stats Data And Models
Authors: Richard D. De Veaux, Paul D. Velleman, David E. Bock
4th Edition
321986490, 978-0321989970, 032198997X, 978-0321986498
Students also viewed these Economics questions
Question
Answered: 1 week ago
Question
Answered: 1 week ago
Question
Answered: 1 week ago
Question
Answered: 1 week ago
Question
Answered: 1 week ago
Question
Answered: 1 week ago
Question
Answered: 1 week ago
Question
Answered: 1 week ago
Question
Answered: 1 week ago
Question
Answered: 1 week ago
Question
Answered: 1 week ago
Question
Answered: 1 week ago
Question
Answered: 1 week ago
Question
Answered: 1 week ago
Question
Answered: 1 week ago
Question
Answered: 1 week ago
Question
Answered: 1 week ago
Question
Answered: 1 week ago
Question
Answered: 1 week ago
View Answer in SolutionInn App


