Question
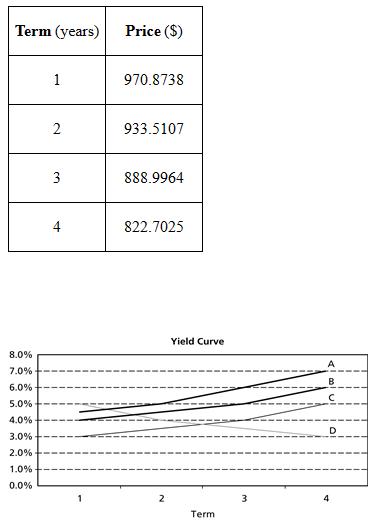
The table below shows market prices for four zero coupon bonds with four different terms: one, two, three, and four years. The bonds all have
The table below shows market prices for four zero coupon bonds with four different terms: one, two, three, and four years. The bonds all have a face value of $1,000. Which line best represents the yield curve derived from the bond prices in the table? Use the letter labels at the end of each line. (hint, compute the yield for each bond)
Zero Coupon Bond Prices
Term (years) 8.0% 7.0% 6.0% 5.0% 4.0% 3.0% 2.0% 1.0% 0.0% 1 2 3 4 Price ($) 970.8738 933.5107 888.9964 822.7025 2 Yield Curve Term 3 A B Term (years) 8.0% 7.0% 6.0% 5.0% 4.0% 3.0% 2.0% 1.0% 0.0% 1 2 3 4 Price ($) 970.8738 933.5107 888.9964 822.7025 2 Yield Curve Term 3 A B
Step by Step Solution
3.32 Rating (137 Votes )
There are 3 Steps involved in it
Step: 1
Spot rate Spot rate year 1 Spot rate year 2 Spot rate y...
Get Instant Access to Expert-Tailored Solutions
See step-by-step solutions with expert insights and AI powered tools for academic success
Step: 2

Step: 3

Ace Your Homework with AI
Get the answers you need in no time with our AI-driven, step-by-step assistance
Get StartedRecommended Textbook for
Marketing Research
Authors: V. Kumar, Robert P. Leone, David A. Aaker, George S. Day
13th Edition
1119497639, 978-1119497639
Students also viewed these Finance questions
Question
Answered: 1 week ago
Question
Answered: 1 week ago
Question
Answered: 1 week ago
Question
Answered: 1 week ago
Question
Answered: 1 week ago
Question
Answered: 1 week ago
Question
Answered: 1 week ago
Question
Answered: 1 week ago
Question
Answered: 1 week ago
Question
Answered: 1 week ago
Question
Answered: 1 week ago
Question
Answered: 1 week ago
Question
Answered: 1 week ago
Question
Answered: 1 week ago
Question
Answered: 1 week ago
Question
Answered: 1 week ago
Question
Answered: 1 week ago
Question
Answered: 1 week ago
Question
Answered: 1 week ago
Question
Answered: 1 week ago
Question
Answered: 1 week ago
Question
Answered: 1 week ago
Question
Answered: 1 week ago
View Answer in SolutionInn App


