

Answered step by step
Verified Expert Solution
Question
1 Approved Answer
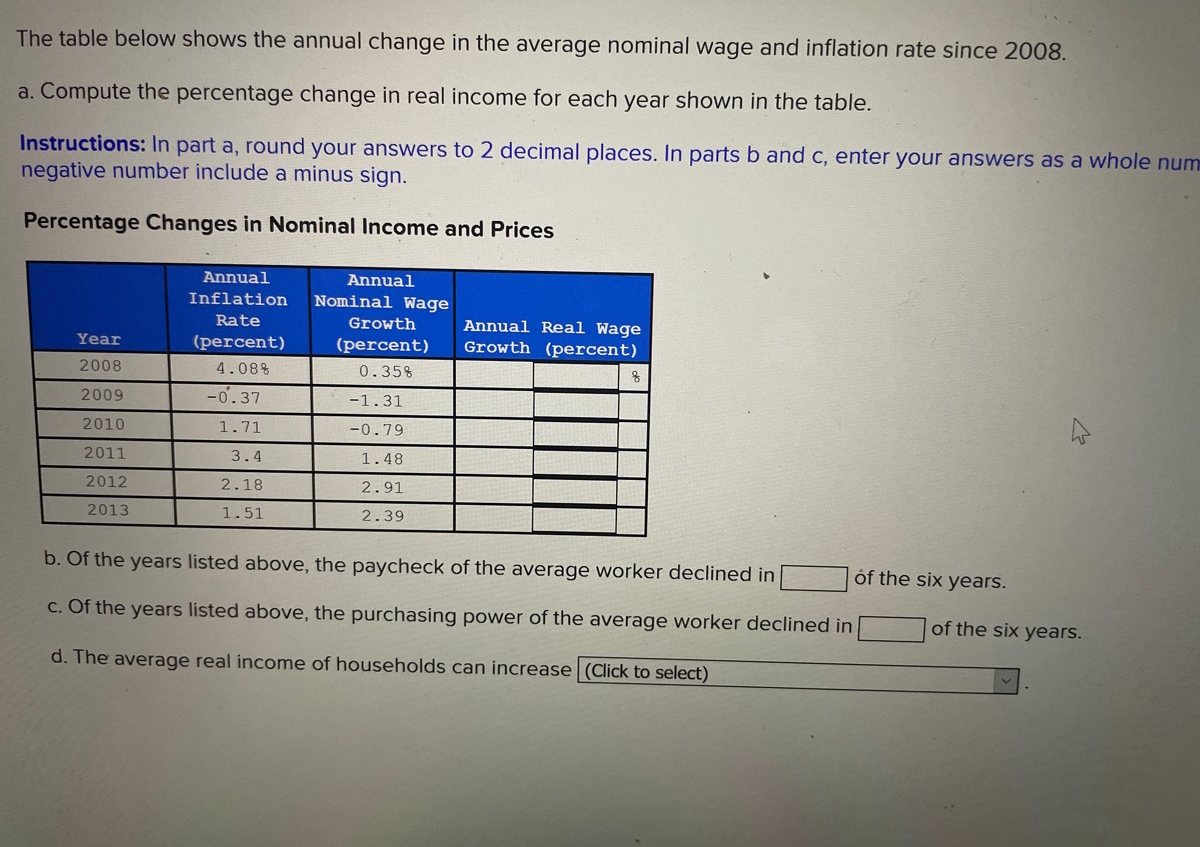
The table below shows the annual change in the average nominal wage and inflation rate since 2 0 0 8 . a . Compute the
The table below shows the annual change in the average nominal wage and inflation rate since
a Compute the percentage change in real income for each year shown in the table.
Instructions: In part a round your answers to decimal places. In parts b and c enter your answers as a whole num negative number include a minus sign.
Percentage Changes in Nominal Income and Prices
tableYeartableAnnualInflationRatepercenttableAnnualNominal WageGrowthpercenttableAnnual Real WageGrowthpercent
b Of the years listed above, the paycheck of the average worker declined in of the six years.
c Of the years listed above, the purchasing power of the average worker declined in of the six years.
d The average real income of households can increase
Step by Step Solution
There are 3 Steps involved in it
Step: 1

Get Instant Access to Expert-Tailored Solutions
See step-by-step solutions with expert insights and AI powered tools for academic success
Step: 2

Step: 3
Ace Your Homework with AI
Get the answers you need in no time with our AI-driven, step-by-step assistance
Get Started
Fundamentals Of Investments Valuation And Management
Authors: Bradford D Jordan, Thomas W. Miller Jr., Steven D. Dolvin
6th Edition
0073530719, 9780073530710