Question
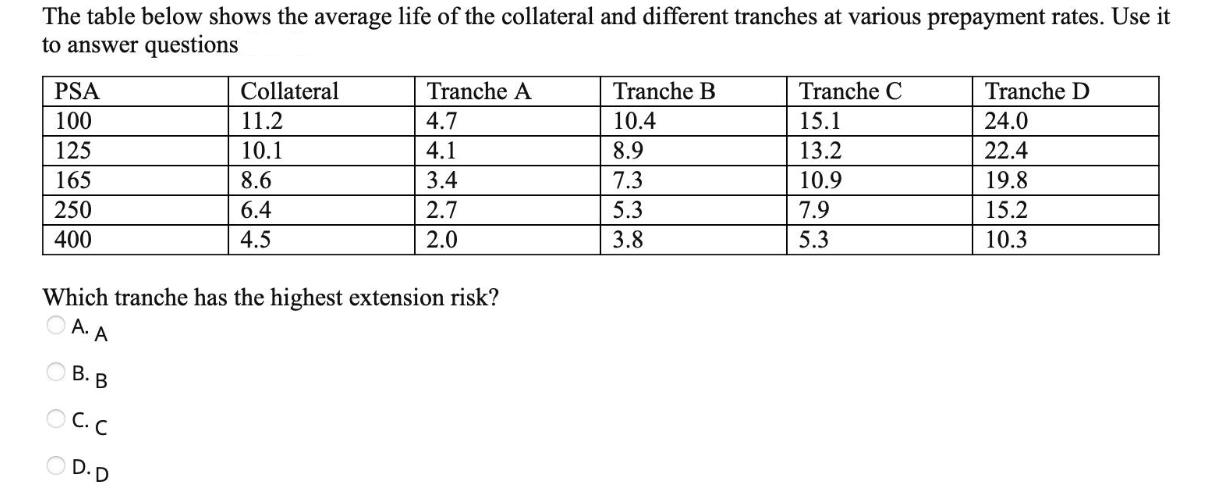
The table below shows the average life of the collateral and different tranches at various prepayment rates. Use it to answer questions PSA 100

The table below shows the average life of the collateral and different tranches at various prepayment rates. Use it to answer questions PSA 100 125 165 250 400 B. B OC.C Collateral 11.2 10.1 8.6 6.4 4.5 Which tranche has the highest extension risk? A. A D.D Tranche A 4.7 4.1 3.4 2.7 2.0 Tranche B 10.4 8.9 7.3 5.3 3.8 Tranche C 15.1 13.2 10.9 7.9 5.3 Tranche D 24.0 22.4 19.8 15.2 10.3
Step by Step Solution
There are 3 Steps involved in it
Step: 1
The detailed answer for the above question is provided below Extension risk refers to the risk ...
Get Instant Access to Expert-Tailored Solutions
See step-by-step solutions with expert insights and AI powered tools for academic success
Step: 2

Step: 3

Ace Your Homework with AI
Get the answers you need in no time with our AI-driven, step-by-step assistance
Get StartedRecommended Textbook for
Fundamentals Of Biostatistics
Authors: Bernard Rosner
8th Edition
130526892X, 978-1305465510, 1305465512, 978-1305268920
Students also viewed these Finance questions
Question
Answered: 1 week ago
Question
Answered: 1 week ago
Question
Answered: 1 week ago
Question
Answered: 1 week ago
Question
Answered: 1 week ago
Question
Answered: 1 week ago
Question
Answered: 1 week ago
Question
Answered: 1 week ago
Question
Answered: 1 week ago
Question
Answered: 1 week ago
Question
Answered: 1 week ago
Question
Answered: 1 week ago
Question
Answered: 1 week ago
Question
Answered: 1 week ago
Question
Answered: 1 week ago
Question
Answered: 1 week ago
Question
Answered: 1 week ago
Question
Answered: 1 week ago
Question
Answered: 1 week ago
Question
Answered: 1 week ago
View Answer in SolutionInn App


