Answered step by step
Verified Expert Solution
Question
1 Approved Answer
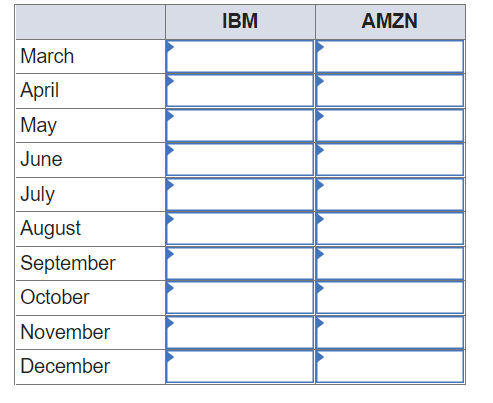
The table below shows the closing monthly stock prices for IBM and Amazon. Calculate the simple three-month moving average for each month for both companies.
The table below shows the closing monthly stock prices for IBM and Amazon. Calculate the simple three-month moving average for each month for both companies. (Input all amounts as positive values. Do not round intermediate calculations. Round your answers to 2 decimal places.)
| IBM | AMZN | ||||||
| January | $ | 170.84 | $ | 603.26 | |||
| February | 174.09 | 615.56 | |||||
| March | 182.65 | 583.94 | |||||
| April | 198.47 | 544.90 | |||||
| May | 195.73 | 524.86 | |||||
| June | 205.41 | 503.98 | |||||
| July | 225.18 | 604.29 | |||||
| August | 212.77 | 540.06 | |||||
| September | 217.19 | 514.52 | |||||
| October | 213.75 | 594.66 | |||||
| November | 193.19 | 597.65 | |||||
| December | 173.66 | 648.10 | |||||

Step by Step Solution
There are 3 Steps involved in it
Step: 1

Get Instant Access to Expert-Tailored Solutions
See step-by-step solutions with expert insights and AI powered tools for academic success
Step: 2

Step: 3

Ace Your Homework with AI
Get the answers you need in no time with our AI-driven, step-by-step assistance
Get Started


