Answered step by step
Verified Expert Solution
Question
1 Approved Answer
The table below shows the closing monthly stock prices for Penn Company and Teller, Incorporated. Calculate the simple three-month moving average for each month for
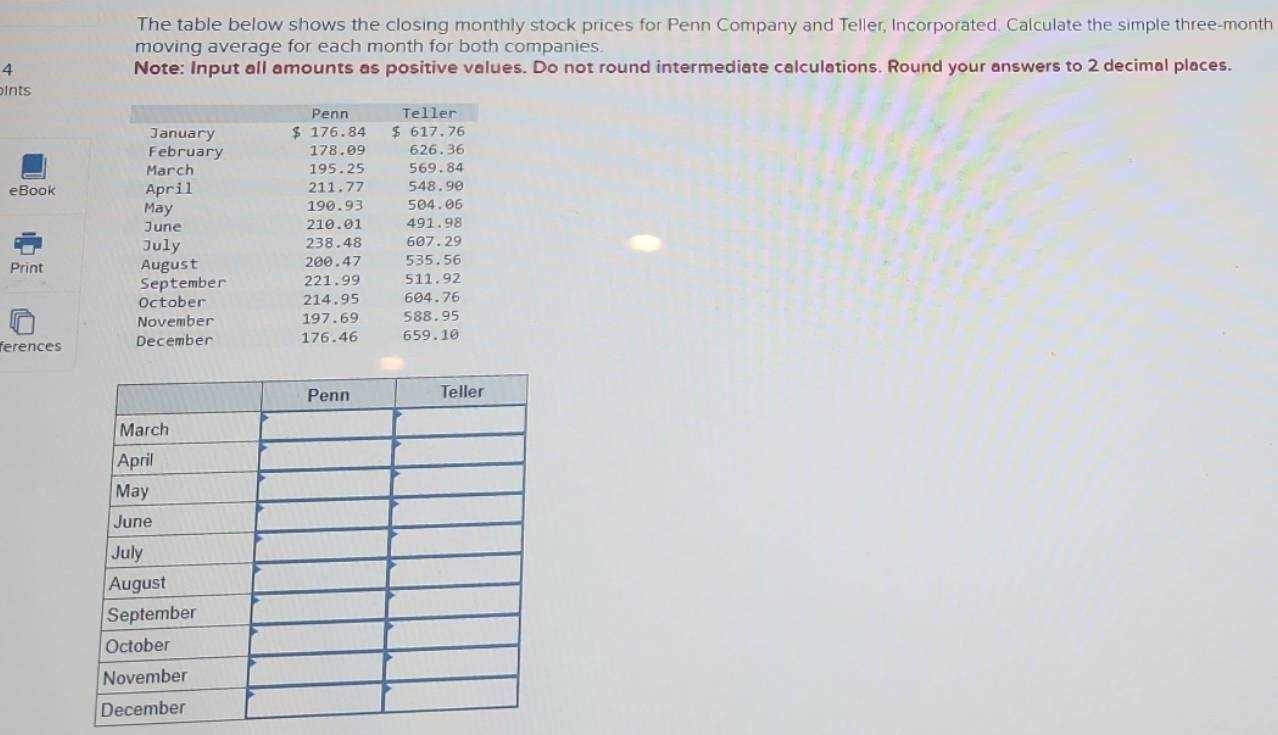
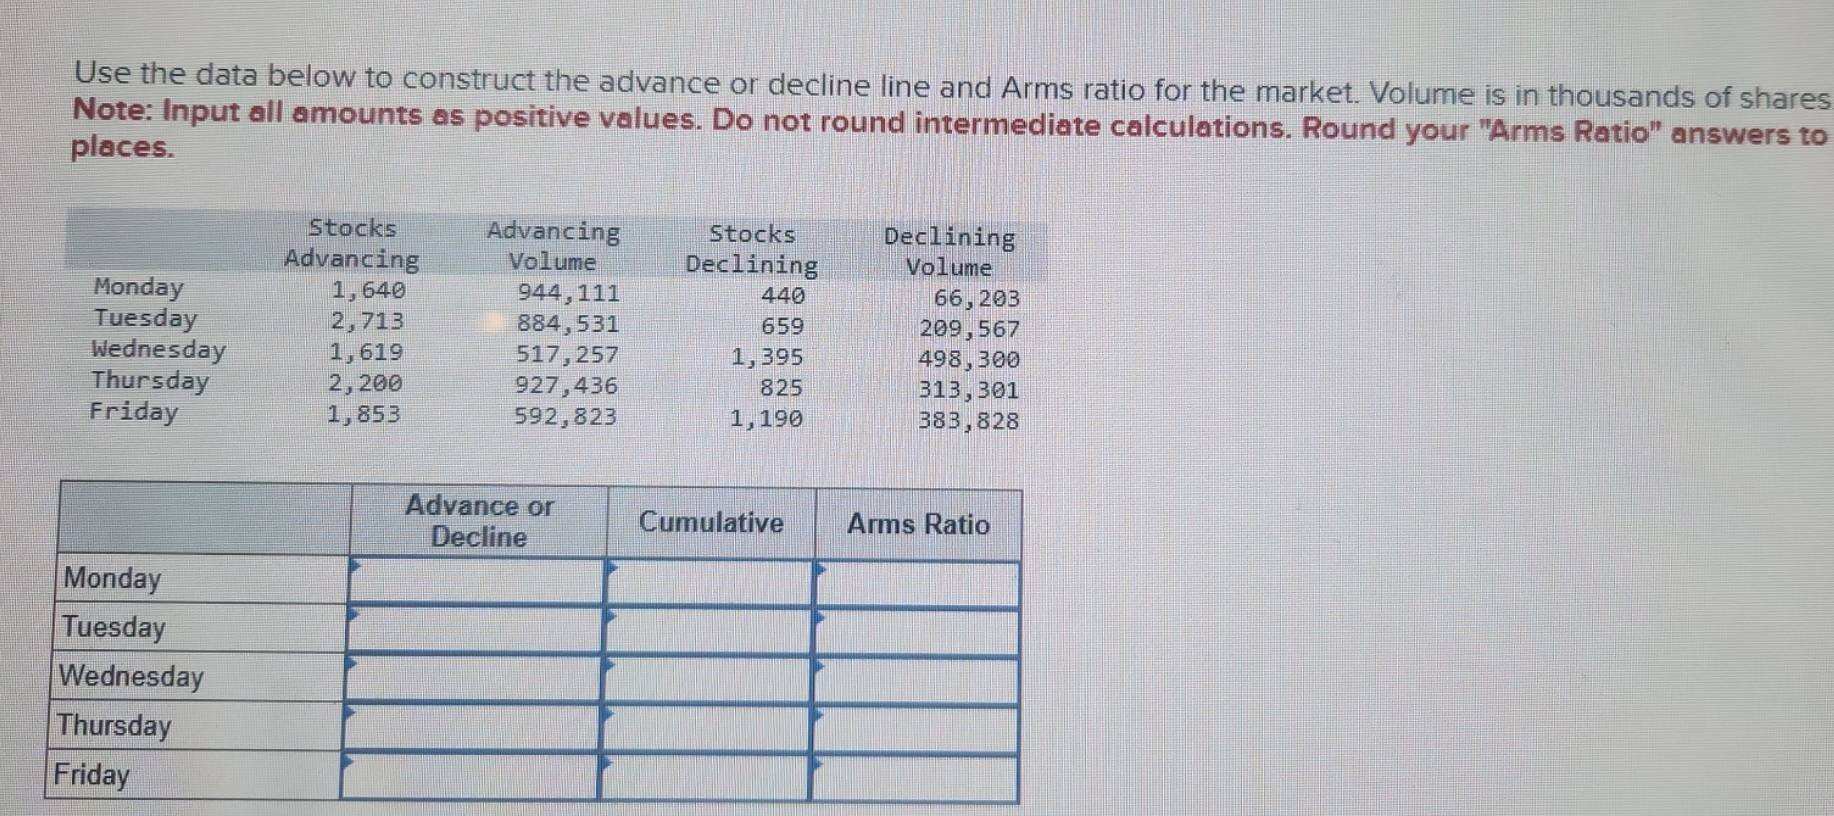
The table below shows the closing monthly stock prices for Penn Company and Teller, Incorporated. Calculate the simple three-month moving average for each month for both companies. 4 Note: Input all amounts as positive values. Do not round intermediate calculations. Round your answers to 2 decimal places. Ints Penn Teller January $ 176.84 $ 617. 76 February 178.09 626. 36 March 195.25 569. 84 ebook April 211 . 77 548.90 May 190.93 504.06 June 210.01 491. 98 July 238.48 607. 29 Print August 200.47 535. 56 September 221.99 511.92 October 214.95 604.76 November 197.69 588. 95 659. 10 erences December 176.46 Penn Teller March April May June July August September October November DecemberUse the data below to construct the advance or decline line and Arms ratio for the market. Volume is in thousands of shares Note: Input all amounts as positive values. Do not round intermediate calculations. Round your "Arms Ratio" answers to places. Stocks Advancing Stocks Declining Advancing Volume Declining Volume Monday 1, 640 944, 111 440 66, 203 Tuesday 2, 713 884, 531 659 209, 567 Wednesday 1, 619 517, 257 1, 395 498, 300 Thursday 2, 200 927,436 825 313, 301 Friday 1, 853 592, 823 1, 190 383, 828 Advance or Decline Cumulative Arms Ratio Monday Tuesday Wednesday Thursday Friday
Step by Step Solution
There are 3 Steps involved in it
Step: 1
Get Instant Access to Expert-Tailored Solutions
See step-by-step solutions with expert insights and AI powered tools for academic success
Step: 2
Step: 3
Ace Your Homework with AI
Get the answers you need in no time with our AI-driven, step-by-step assistance
Get Started