

Question
The table below shows the expected rates of return for three stocks and their weights in some portfolio: Part 1 What is the expected portfolio
The table below shows the expected rates of return for three stocks and their weights in some portfolio:
Part 1
What is the expected portfolio return?
Part 2
What is the standard deviation of the portfolio returns?
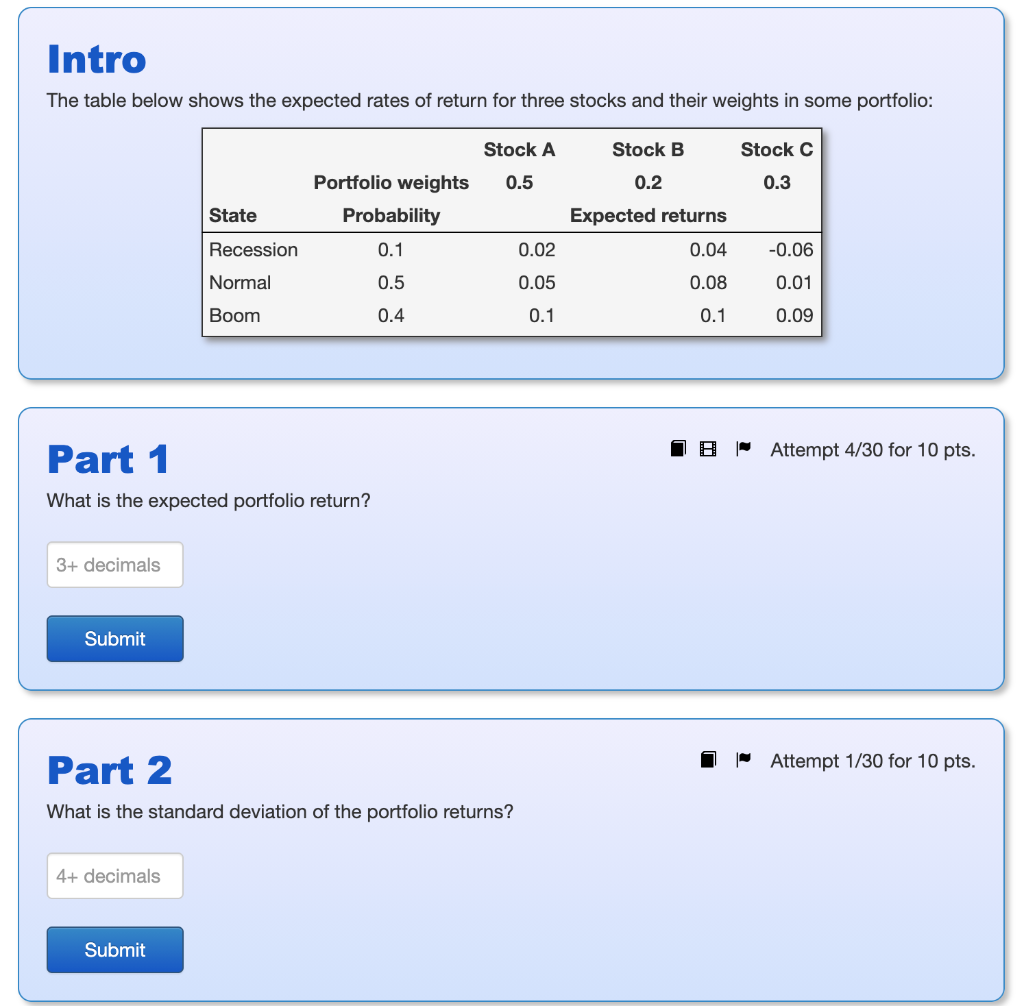
Intro The table below shows the expected rates of return for three stocks and their weights in some portfolio: Stock A Stock B Stock C Portfolio weights 0.5 0.2 0.3 State Probability Expected returns Recession 0.1 0.02 0.04 -0.06 Normal 0.5 0.05 0.08 0.01 Boom 0.4 0.1 0.1 0.09 Part 1 18 Attempt 4/30 for 10 pts. What is the expected portfolio return? 3+ decimals Submit Part 2 Attempt 1/30 for 10 pts. What is the standard deviation of the portfolio returns? 4+ decimals Submit
Step by Step Solution
There are 3 Steps involved in it
Step: 1

Get Instant Access to Expert-Tailored Solutions
See step-by-step solutions with expert insights and AI powered tools for academic success
Step: 2

Step: 3
Ace Your Homework with AI
Get the answers you need in no time with our AI-driven, step-by-step assistance
Get Started
Public Finance
Authors: Harvey Rosen, Ted Gayer
10th edition
9781259716874, 78021685, 1259716872, 978-0078021688