

Question
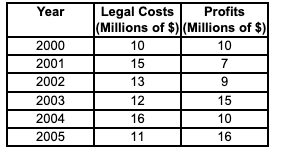
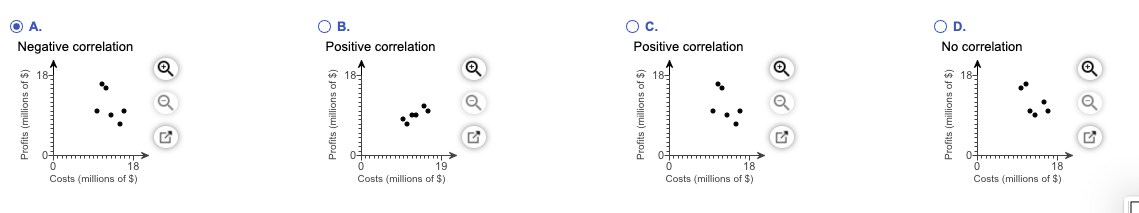
The table below shows the legal costs and the profits of a company from 2000 to 2005. Construct a scatter diagram for the data and
The table below shows the legal costs and the profits of a company from 2000 to 2005. Construct a scatter diagram for the data and state whether legal costs and profits for this company have no? correlation, a positive? correlation, or a negative correlation for this period.
Step by Step Solution
There are 3 Steps involved in it
Step: 1

Get Instant Access to Expert-Tailored Solutions
See step-by-step solutions with expert insights and AI powered tools for academic success
Step: 2

Step: 3
Ace Your Homework with AI
Get the answers you need in no time with our AI-driven, step-by-step assistance
Get Started
Trigonometry
Authors: David M Kennedy, James Stewart, Lothar Redlin, Saleem Watson
2nd Edition
1285226089, 9781285226088