Answered step by step
Verified Expert Solution
Link Copied!

Question

1 Approved Answer

The table below shows the lost time accident history of this supermarket over the past 3 years. Year 1 2* 3 Number of reported 12
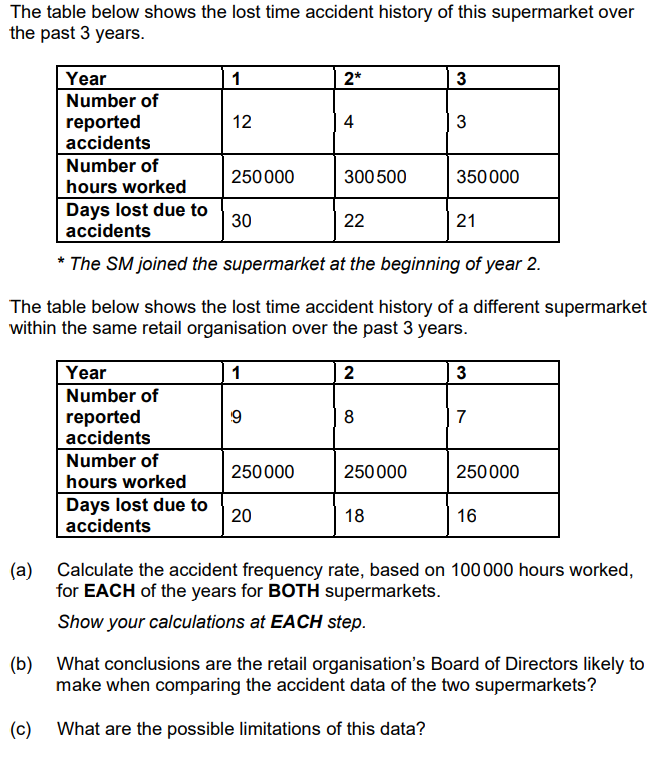
image text in transcribed
The table below shows the lost time accident history of this supermarket over the past 3 years. Year 1 2* 3 Number of reported 12 4 3 accidents Number of hours worked 250 000 300 500 350 000 Days lost due to accidents 30 22 21 * The SM joined the supermarket at the beginning of year 2. The table below shows the lost time accident history of a different supermarket within the same retail organisation over the past 3 years. Year 1 2 3 Number of reported 9 8 7 accidents Number of hours worked 250 000 250 000 250 000 Days lost due to 20 accidents 18 16 (a) Calculate the accident frequency rate, based on 100 000 hours worked, for EACH of the years for BOTH supermarkets. Show your calculations at EACH step. (b) What conclusions are the retail organisation's Board of Directors likely to make when comparing the accident data of the two supermarkets? (c) What are the possible limitations of this data

Step by Step Solution

There are 3 Steps involved in it

Step: 1

blur-text-image

Get Instant Access to Expert-Tailored Solutions

See step-by-step solutions with expert insights and AI powered tools for academic success

Step: 2

blur-text-image

Step: 3

blur-text-image

Ace Your Homework with AI

Get the answers you need in no time with our AI-driven, step-by-step assistance

Get Started

Recommended Textbook for

An Introduction to the Mathematics of financial Derivatives

Authors: Salih N. Neftci

2nd Edition

978-0125153928, 9780080478647, 125153929, 978-0123846822

More Books

Students also viewed these Mathematics questions

Question

What do the upside down question marks indicate in the equation?

Answered: 1 week ago