Question
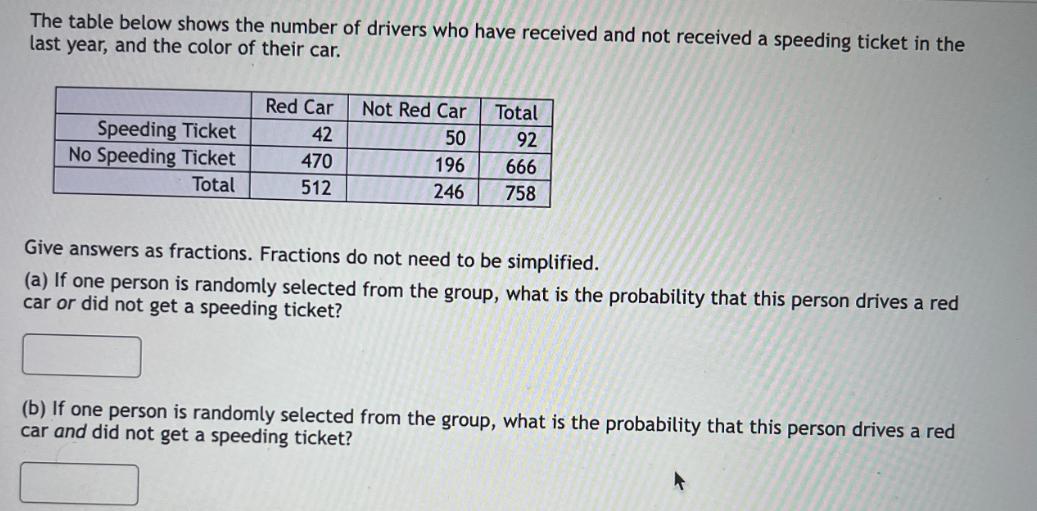
The table below shows the number of drivers who have received and not received a speeding ticket in the last year, and the color

The table below shows the number of drivers who have received and not received a speeding ticket in the last year, and the color of their car. Red Car Not Red Car Total Speeding Ticket No Speeding Ticket 42 50 92 470 196 666 Total 512 246 758 Give answers as fractions. Fractions do not need to be simplified. (a) If one person is randomly selected from the group, what is the probability that this person drives a red car or did not get a speeding ticket? (b) If one person is randomly selected from the group, what is the probability that this person drives a red car and did not get a speeding ticket?
Step by Step Solution
There are 3 Steps involved in it
Step: 1

Get Instant Access to Expert-Tailored Solutions
See step-by-step solutions with expert insights and AI powered tools for academic success
Step: 2

Step: 3

Ace Your Homework with AI
Get the answers you need in no time with our AI-driven, step-by-step assistance
Get StartedRecommended Textbook for
Seeing Through Statistics
Authors: Jessica M.Utts
4th Edition
1285050886, 978-1305176249, 1305176243, 978-1305322394, 978-1285050881
Students also viewed these Mathematics questions
Question
Answered: 1 week ago
Question
Answered: 1 week ago
Question
Answered: 1 week ago
Question
Answered: 1 week ago
Question
Answered: 1 week ago
Question
Answered: 1 week ago
Question
Answered: 1 week ago
Question
Answered: 1 week ago
Question
Answered: 1 week ago
Question
Answered: 1 week ago
Question
Answered: 1 week ago
Question
Answered: 1 week ago
Question
Answered: 1 week ago
Question
Answered: 1 week ago
Question
Answered: 1 week ago
Question
Answered: 1 week ago
Question
Answered: 1 week ago
Question
Answered: 1 week ago
Question
Answered: 1 week ago
Question
Answered: 1 week ago
Question
Answered: 1 week ago
Question
Answered: 1 week ago
View Answer in SolutionInn App


