Question
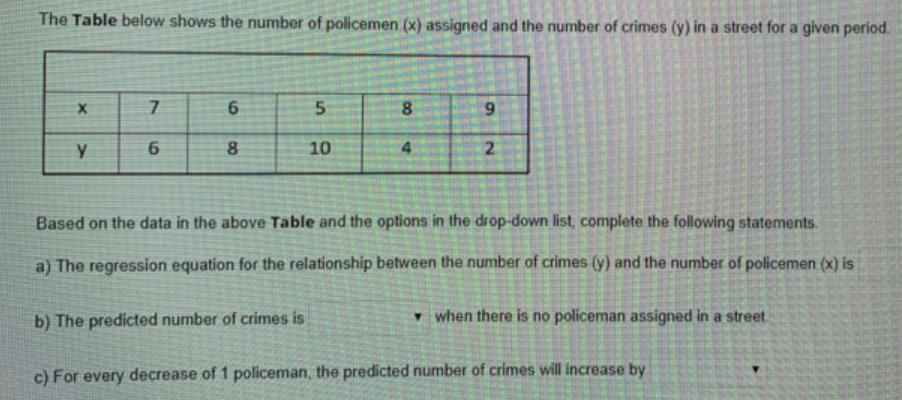
The Table below shows the number of policemen (x) assigned and the number of crimes (y) in a street for a given period. 6.

The Table below shows the number of policemen (x) assigned and the number of crimes (y) in a street for a given period. 6. 8 6. 8 10 4. 2. Based on the data in the above Table and the options in the drop-down list, complete the following statements. a) The regression equation for the relationship between the number of crimes (y) and the number of policemen (x) is b) The predicted number of crimes is v when there is no policeman assigned in a street c) For every decrease of 1 policeman, the predicted number of crimes will increase by
Step by Step Solution
3.36 Rating (162 Votes )
There are 3 Steps involved in it
Step: 1
a bput x ...
Get Instant Access to Expert-Tailored Solutions
See step-by-step solutions with expert insights and AI powered tools for academic success
Step: 2

Step: 3

Ace Your Homework with AI
Get the answers you need in no time with our AI-driven, step-by-step assistance
Get StartedRecommended Textbook for
Elementary Statistics A Step By Step Approach
Authors: Allan Bluman
8th Edition
73386103, 978-0073386102
Students also viewed these Accounting questions
Question
Answered: 1 week ago
Question
Answered: 1 week ago
Question
Answered: 1 week ago
Question
Answered: 1 week ago
Question
Answered: 1 week ago
Question
Answered: 1 week ago
Question
Answered: 1 week ago
Question
Answered: 1 week ago
Question
Answered: 1 week ago
Question
Answered: 1 week ago
Question
Answered: 1 week ago
Question
Answered: 1 week ago
Question
Answered: 1 week ago
Question
Answered: 1 week ago
Question
Answered: 1 week ago
Question
Answered: 1 week ago
Question
Answered: 1 week ago
Question
Answered: 1 week ago
Question
Answered: 1 week ago
Question
Answered: 1 week ago
Question
Answered: 1 week ago
Question
Answered: 1 week ago
View Answer in SolutionInn App


