

Answered step by step
Verified Expert Solution
Question
1 Approved Answer
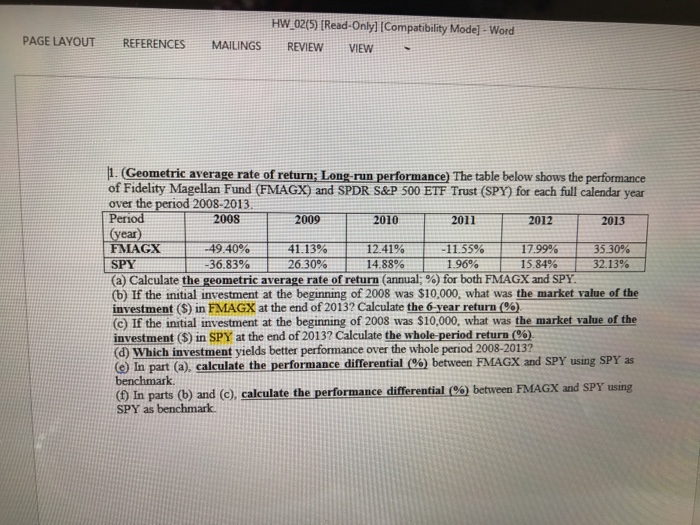
The table below shows the performance of Fidelity Magellan Fund (FMAGX) and SPDR S&P 500 ETF Trust (SPY) for each full calendar year over the
Step by Step Solution
There are 3 Steps involved in it
Step: 1

Get Instant Access to Expert-Tailored Solutions
See step-by-step solutions with expert insights and AI powered tools for academic success
Step: 2

Step: 3
Ace Your Homework with AI
Get the answers you need in no time with our AI-driven, step-by-step assistance
Get Started
Finance And Industrial Policy
Authors: Giovanni Cozzi, Susan Newman, Jan Toporowski
1st Edition
0198744501, 978-0198744504