

Answered step by step
Verified Expert Solution
Question
1 Approved Answer
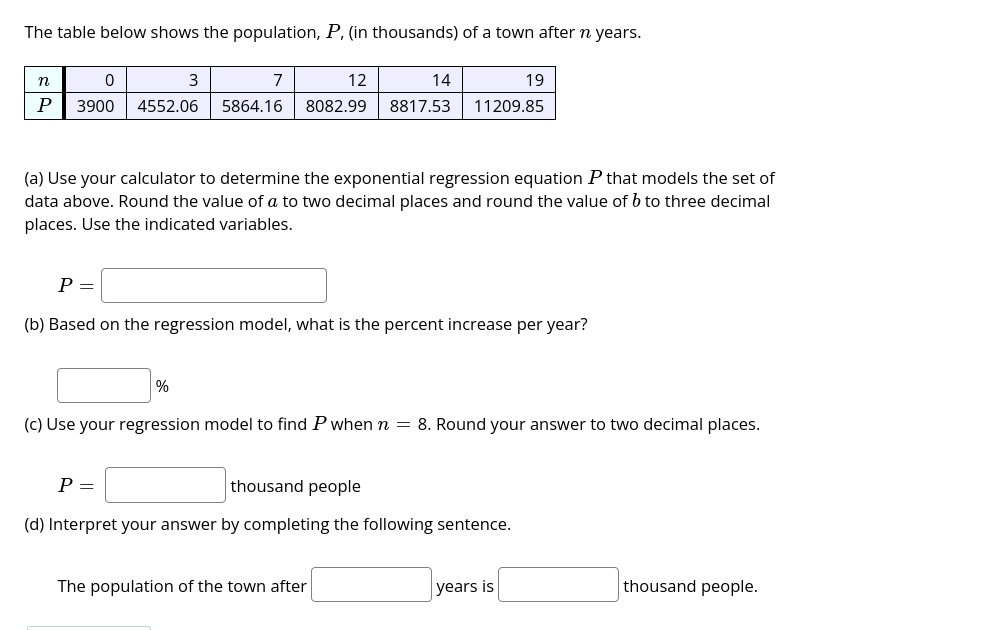
The table below shows the population, P. (in thousands} of a town after 13. years. n D 3 7 12 14 19 P 3900 4552.06
Step by Step Solution
There are 3 Steps involved in it
Step: 1

Get Instant Access to Expert-Tailored Solutions
See step-by-step solutions with expert insights and AI powered tools for academic success
Step: 2

Step: 3
Ace Your Homework with AI
Get the answers you need in no time with our AI-driven, step-by-step assistance
Get Started
Trigonometry
Authors: Ron Larson, Rosemarie Menager Beeley, Larson/Hostetler
8th Edition
1111789177, 9781111789176