

Answered step by step
Verified Expert Solution
Question
1 Approved Answer
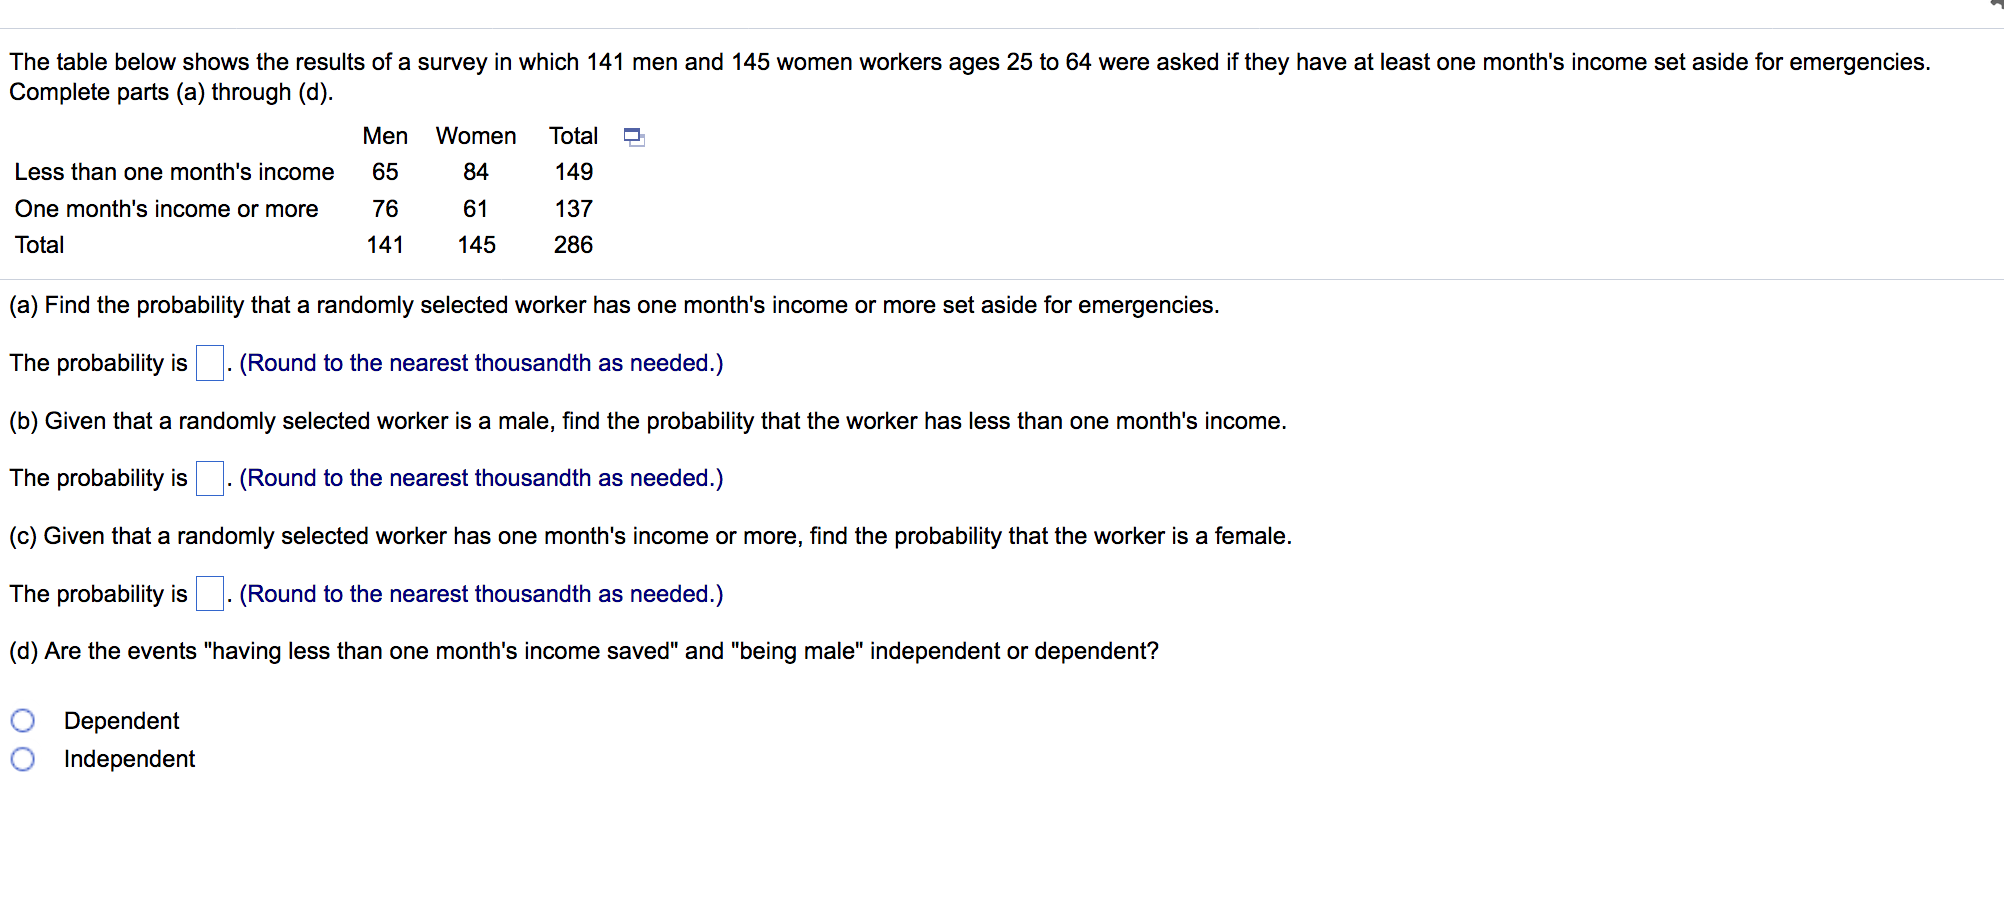
The table below shows the results of a survey in which 141 men and 145 women workers ages 25-64 were asked.. The table below shows
The table below shows the results of a survey in which 141 men and 145 women workers ages 25-64 were asked..
Step by Step Solution
There are 3 Steps involved in it
Step: 1

Get Instant Access to Expert-Tailored Solutions
See step-by-step solutions with expert insights and AI powered tools for academic success
Step: 2

Step: 3
Ace Your Homework with AI
Get the answers you need in no time with our AI-driven, step-by-step assistance
Get Started
College Algebra
Authors: Margaret L. Lial, John Hornsby, David I. Schneider, Callie Daniels
12th edition
134697022, 9780134313795 , 978-0134697024