Answered step by step
Verified Expert Solution
Link Copied!

Question

1 Approved Answer

The table below shows your stock positions at the beginning of the year, the dividends that each stock paid during the year, and t stock
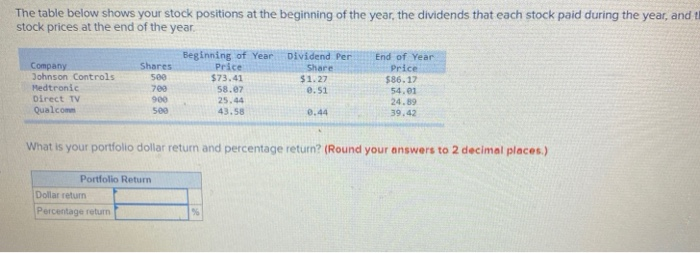
image text in transcribed
The table below shows your stock positions at the beginning of the year, the dividends that each stock paid during the year, and t stock prices at the end of the year Company Johnson Controls Medtronic Direct TV Qualcomm Shares 500 709 900 509 Beginning of Year Dividend Per Price Share $73.41 $1.27 58.ez 0.51 25.44 43.58 End of Year Price 586.17 54.01 24.89 39.42 What is your portfolio dollar return and percentage return? (Round your answers to 2 decimal places.) Portfolio Return Dollar return Percentage return

Step by Step Solution

There are 3 Steps involved in it

Step: 1

blur-text-image

Get Instant Access to Expert-Tailored Solutions

See step-by-step solutions with expert insights and AI powered tools for academic success

Step: 2

blur-text-image

Step: 3

blur-text-image

Ace Your Homework with AI

Get the answers you need in no time with our AI-driven, step-by-step assistance

Get Started

Recommended Textbook for

More Books

Students also viewed these Accounting questions