

Answered step by step
Verified Expert Solution
Question
1 Approved Answer
The table below (Table 8.9, BMA) shows the correlation between returns of 7 different stocks. How likely is it that an equally weighted portfolio of
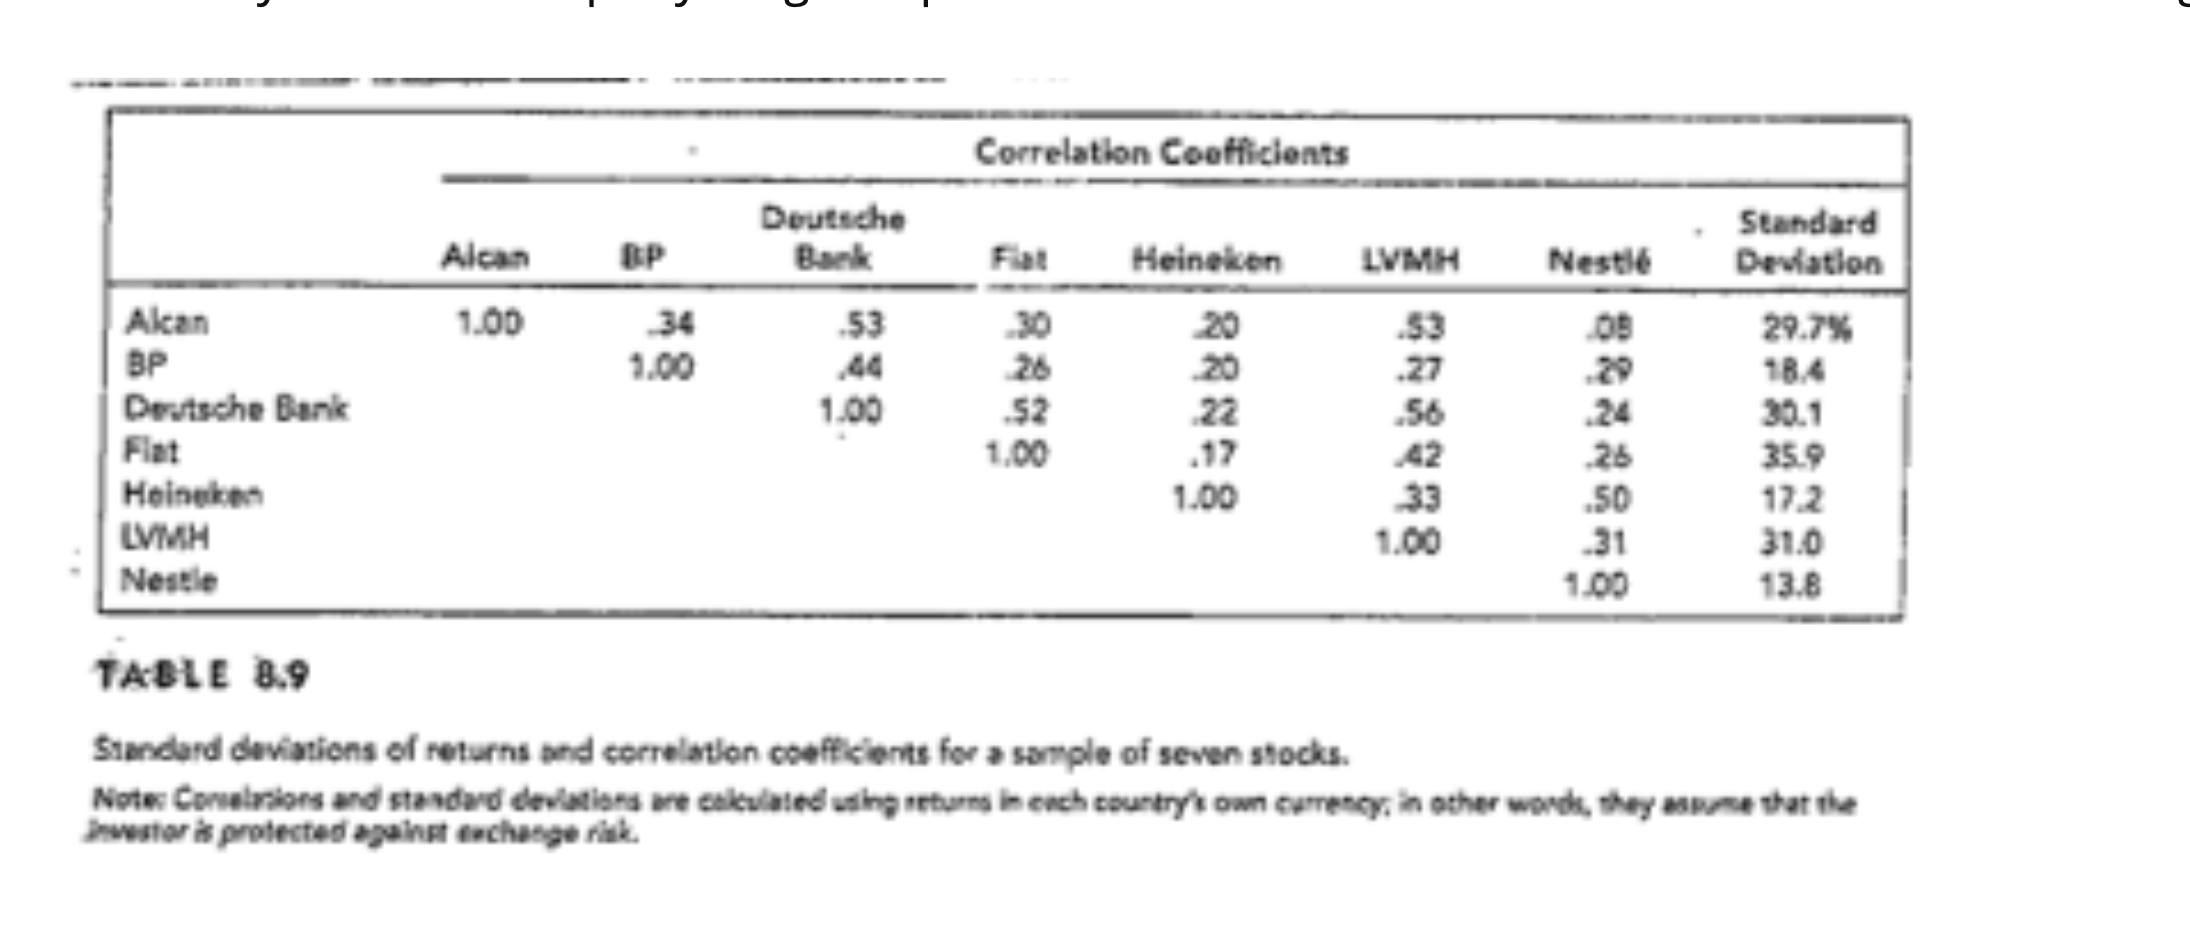 The table below (Table 8.9, BMA) shows the correlation between returns of 7 different stocks. How likely is it that an equally weighted portfolio of the 7 stocks has a standard deviation exceeding 25%? Explain.
Step by Step Solution
There are 3 Steps involved in it
Step: 1

Get Instant Access to Expert-Tailored Solutions
See step-by-step solutions with expert insights and AI powered tools for academic success
Step: 2

Step: 3
Ace Your Homework with AI
Get the answers you need in no time with our AI-driven, step-by-step assistance
Get Started
Chinas Trade Exchange Rate And Industrial Policy Structure
Authors: John Whalley
1st Edition
9814401870,9814401897