Answered step by step
Verified Expert Solution
Question
1 Approved Answer
The table gives the total emissions of lead into the atmosphere for selected years. Total Lead Emissions into the Atmosphere Year Lead, f (million

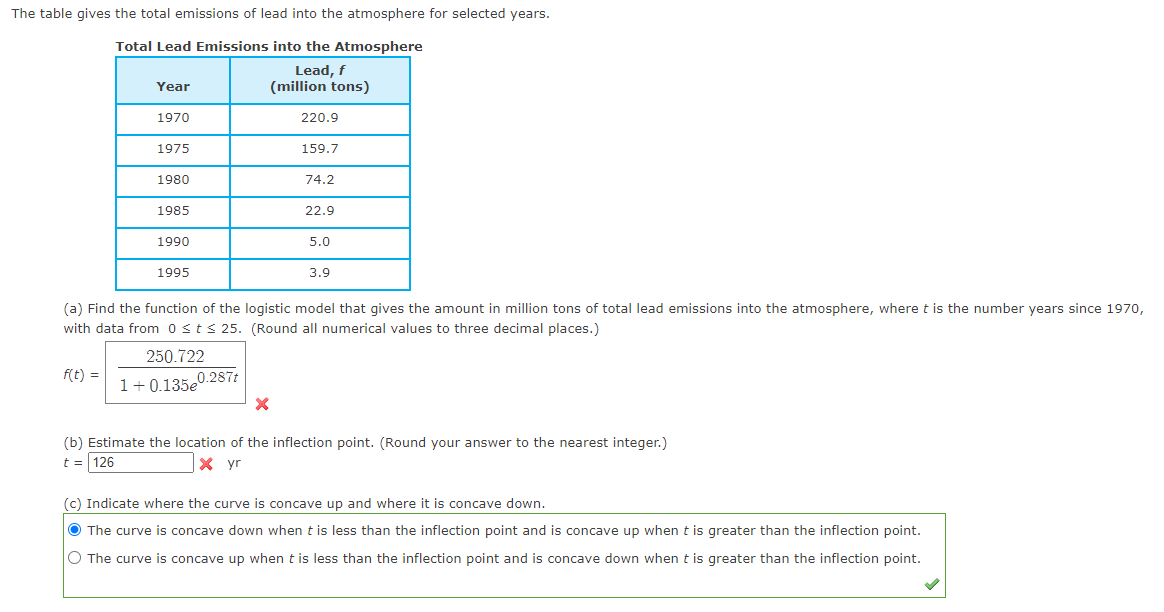
The table gives the total emissions of lead into the atmosphere for selected years. Total Lead Emissions into the Atmosphere Year Lead, f (million tons) 1970 220.9 1975 159.7 1980 74.2 1985 22.9 1990 1995 5.0 3.9 (a) Find the function of the logistic model that gives the amount in million tons of total lead emissions into the atmosphere, where t is the number years since 1970, with data from 0 t 25. (Round all numerical values to three decimal places.) f(t) = 250.722 1+0.135e 0.287t (b) Estimate the location of the inflection point. (Round your answer to the nearest integer.) t = 126 x yr (c) Indicate where the curve is concave up and where it is concave down. The curve is concave down when t is less than the inflection point and is concave up when t is greater than the inflection point. The curve is concave up when t is less than the inflection point and is concave down when t is greater than the inflection point.
Step by Step Solution
There are 3 Steps involved in it
Step: 1
a To find the function of the logistic model we need to fit the given data into the logistic equatio...
Get Instant Access to Expert-Tailored Solutions
See step-by-step solutions with expert insights and AI powered tools for academic success
Step: 2

Step: 3

Ace Your Homework with AI
Get the answers you need in no time with our AI-driven, step-by-step assistance
Get Started


