

Answered step by step
Verified Expert Solution
Question
1 Approved Answer
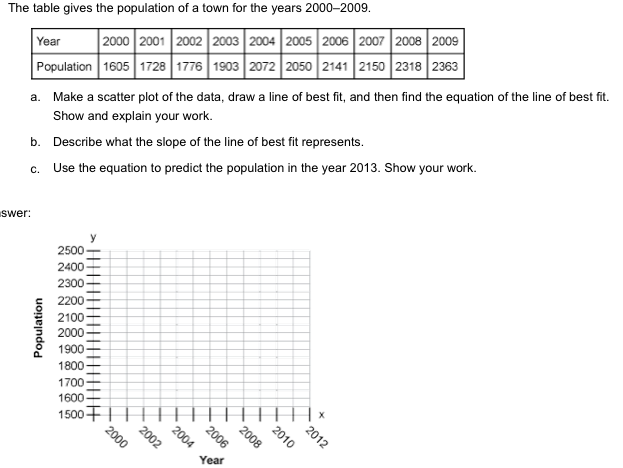
The table giyee the populatlon of a town for the years zoneamt}. -Mmmmmwmm MIME-MEM@ a. Make a scatter plot of the data. draw a line
Step by Step Solution
There are 3 Steps involved in it
Step: 1

Get Instant Access to Expert-Tailored Solutions
See step-by-step solutions with expert insights and AI powered tools for academic success
Step: 2

Step: 3
Ace Your Homework with AI
Get the answers you need in no time with our AI-driven, step-by-step assistance
Get Started
Linear Algebra A Modern Introduction
Authors: David Poole
4th edition
1285463242, 978-1285982830, 1285982835, 978-1285463247