

Answered step by step
Verified Expert Solution
Question
1 Approved Answer
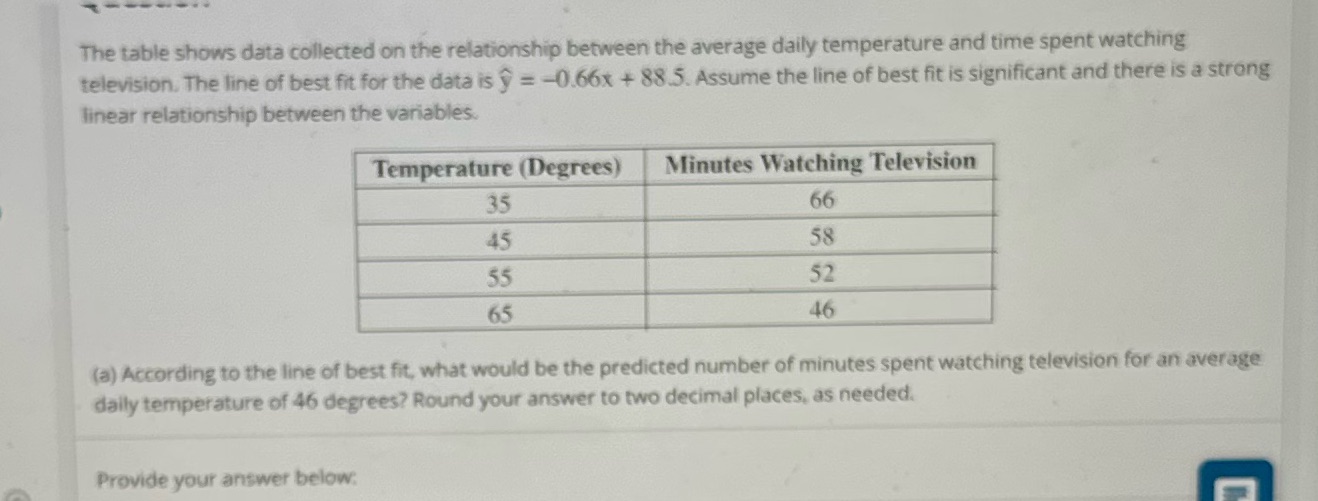
The table shows data collected on the relationship between the average daily temperature and time spent watching television. The line of best fit for the
Step by Step Solution
There are 3 Steps involved in it
Step: 1

Get Instant Access to Expert-Tailored Solutions
See step-by-step solutions with expert insights and AI powered tools for academic success
Step: 2

Step: 3
Ace Your Homework with AI
Get the answers you need in no time with our AI-driven, step-by-step assistance
Get Started
A First Course in General Relativity
Authors: Bernard Schutz
2nd edition
521887054, 978-0521887052