Question
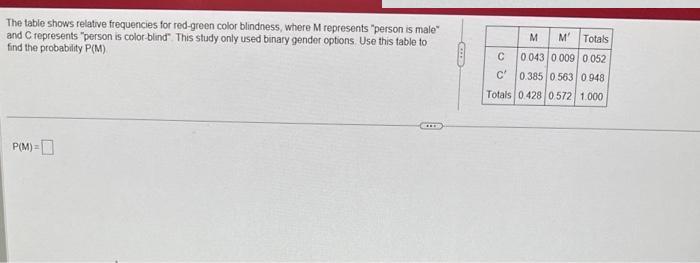
The table shows relative frequencies for red-green color blindness, where M represents person is male and C represents person is color-blind. This study only

The table shows relative frequencies for red-green color blindness, where M represents "person is male" and C represents "person is color-blind". This study only used binary gender options. Use this table to find the probability P(M) P(M)= M M' Totals 0 043 0009 0 052 0.385 0 563 0948 Totals 0.428 0.572 1.000 C C'
Step by Step Solution
3.38 Rating (160 Votes )
There are 3 Steps involved in it
Step: 1
To find the probability PM we need to sum up ...
Get Instant Access to Expert-Tailored Solutions
See step-by-step solutions with expert insights and AI powered tools for academic success
Step: 2

Step: 3

Ace Your Homework with AI
Get the answers you need in no time with our AI-driven, step-by-step assistance
Get StartedRecommended Textbook for
Statistics
Authors: Robert S. Witte, John S. Witte
10th Edition
9781118805350, 1118450531, 1118805356, 978-1118450536
Students also viewed these Mathematics questions
Question
Answered: 1 week ago
Question
Answered: 1 week ago
Question
Answered: 1 week ago
Question
Answered: 1 week ago
Question
Answered: 1 week ago
Question
Answered: 1 week ago
Question
Answered: 1 week ago
Question
Answered: 1 week ago
Question
Answered: 1 week ago
Question
Answered: 1 week ago
Question
Answered: 1 week ago
Question
Answered: 1 week ago
Question
Answered: 1 week ago
Question
Answered: 1 week ago
Question
Answered: 1 week ago
Question
Answered: 1 week ago
Question
Answered: 1 week ago
Question
Answered: 1 week ago
Question
Answered: 1 week ago
Question
Answered: 1 week ago
Question
Answered: 1 week ago
Question
Answered: 1 week ago
View Answer in SolutionInn App


