Question
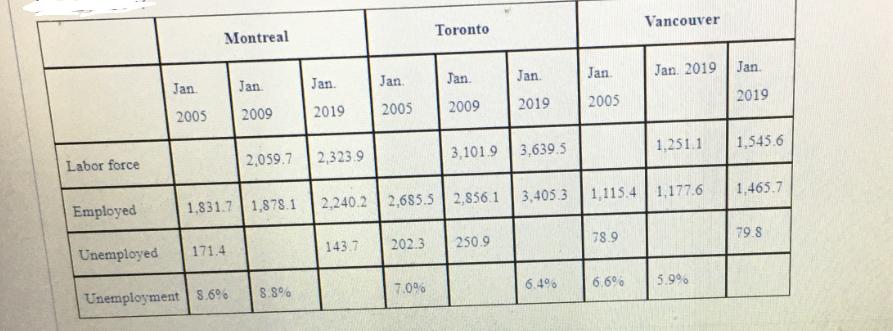
The table shows statistics for three Canadian cities at several different points in time. What was the unemployment rate in Toronto in January 2009?


The table shows statistics for three Canadian cities at several different points in time. What was the unemployment rate in Toronto in January 2009? Labor force Employed Unemployed Jan. 2005 Montreal 171.4 Jan. 2009 1,831.7 1,878.1 Unemployment 5.6% 2,059.7 8.8% Jan. 2019 2,323.9 Jan. 2005 2,240.2 2,685.5 143.7 202.3 7.0% Toronto Jan. 2009 3,101.9 3,639.5 2,856.1 Jan. 2019 250.9 3,405.3 6.4% Jan. 2005 1,115.4 78.9 6.6% Vancouver Jan. 2019 1,251.1 1,177.6 5.9% Jan. 2019 1,545.6 1,465.7 79.8
Step by Step Solution
3.51 Rating (148 Votes )
There are 3 Steps involved in it
Step: 1
The table shows the unemployment rates for Montreal Toronto and Vancouver for the ...
Get Instant Access to Expert-Tailored Solutions
See step-by-step solutions with expert insights and AI powered tools for academic success
Step: 2

Step: 3

Ace Your Homework with AI
Get the answers you need in no time with our AI-driven, step-by-step assistance
Get StartedRecommended Textbook for
Statistical Techniques In Business And Economics
Authors: Douglas Lind, William Marchal
16th Edition
78020522, 978-0078020520
Students also viewed these Economics questions
Question
Answered: 1 week ago
Question
Answered: 1 week ago
Question
Answered: 1 week ago
Question
Answered: 1 week ago
Question
Answered: 1 week ago
Question
Answered: 1 week ago
Question
Answered: 1 week ago
Question
Answered: 1 week ago
Question
Answered: 1 week ago
Question
Answered: 1 week ago
Question
Answered: 1 week ago
Question
Answered: 1 week ago
Question
Answered: 1 week ago
Question
Answered: 1 week ago
Question
Answered: 1 week ago
Question
Answered: 1 week ago
Question
Answered: 1 week ago
Question
Answered: 1 week ago
Question
Answered: 1 week ago
Question
Answered: 1 week ago
Question
Answered: 1 week ago
View Answer in SolutionInn App


