Answered step by step
Verified Expert Solution
Question
1 Approved Answer
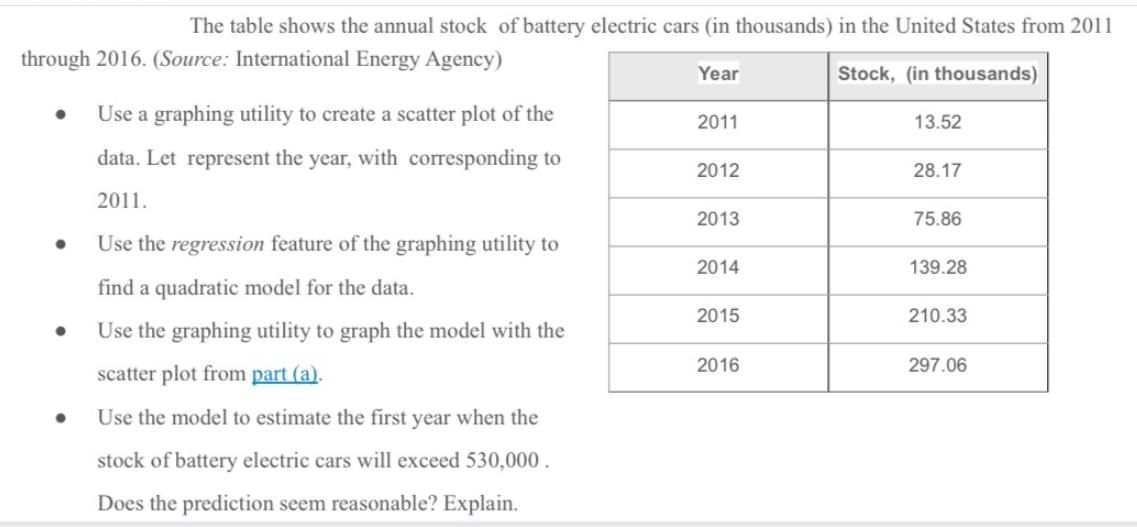
The table shows the annual stock of battery electric cars (in thousands) in the United States from 2011 through 2016. (Source: International Energy Agency)

The table shows the annual stock of battery electric cars (in thousands) in the United States from 2011 through 2016. (Source: International Energy Agency) Year Stock, (in thousands) Use a graphing utility to create a scatter plot of the data. Let represent the year, with corresponding to 2011 13.52 2012 28.17 2011. 2013 75.86 Use the regression feature of the graphing utility to 2014 139.28 find a quadratic model for the data. 2015 210.33 Use the graphing utility to graph the model with the scatter plot from part (a). 2016 297.06 Use the model to estimate the first year when the stock of battery electric cars will exceed 530,000. Does the prediction seem reasonable? Explain.
Step by Step Solution
There are 3 Steps involved in it
Step: 1

Get Instant Access to Expert-Tailored Solutions
See step-by-step solutions with expert insights and AI powered tools for academic success
Step: 2

Step: 3

Ace Your Homework with AI
Get the answers you need in no time with our AI-driven, step-by-step assistance
Get Started


