Question
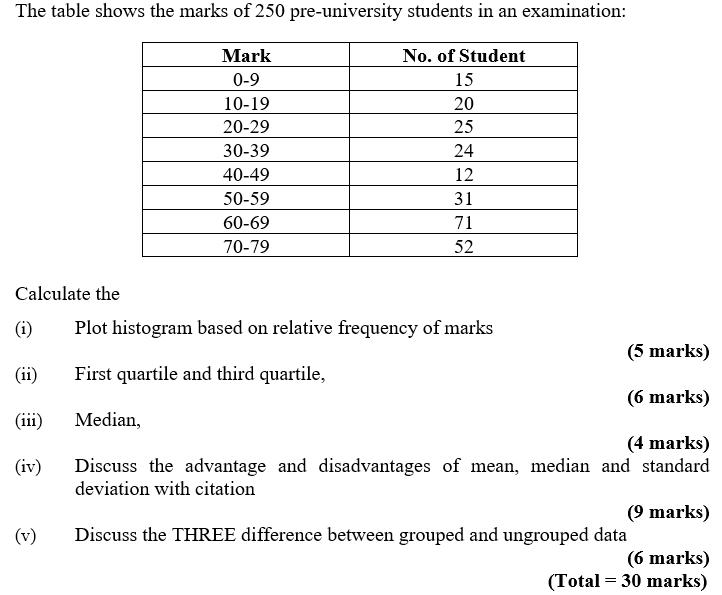
The table shows the marks of 250 pre-university students in an examination: Mark 0-9 No. of Student 15 10-19 20 20-29 25 30-39 24

The table shows the marks of 250 pre-university students in an examination: Mark 0-9 No. of Student 15 10-19 20 20-29 25 30-39 24 40-49 12 50-59 31 60-69 71 70-79 52 Calculate the (i) Plot histogram based on relative frequency of marks (5 marks) (ii) First quartile and third quartile, (6 marks) (iii) Median, (4 marks) (iv) Discuss the advantage and disadvantages of mean, median and standard deviation with citation (9 marks) (v) Discuss the THREE difference between grouped and ungrouped data (6 marks) (Total 30 marks)
Step by Step Solution
There are 3 Steps involved in it
Step: 1

Get Instant Access to Expert-Tailored Solutions
See step-by-step solutions with expert insights and AI powered tools for academic success
Step: 2

Step: 3

Ace Your Homework with AI
Get the answers you need in no time with our AI-driven, step-by-step assistance
Get StartedRecommended Textbook for
An Introduction To Statistical Methods And Data Analysis
Authors: R. Lyman Ott, Micheal T. Longnecker
7th Edition
1305269470, 978-1305465527, 1305465520, 978-1305269477
Students also viewed these Finance questions
Question
Answered: 1 week ago
Question
Answered: 1 week ago
Question
Answered: 1 week ago
Question
Answered: 1 week ago
Question
Answered: 1 week ago
Question
Answered: 1 week ago
Question
Answered: 1 week ago
Question
Answered: 1 week ago
Question
Answered: 1 week ago
Question
Answered: 1 week ago
Question
Answered: 1 week ago
Question
Answered: 1 week ago
Question
Answered: 1 week ago
Question
Answered: 1 week ago
Question
Answered: 1 week ago
Question
Answered: 1 week ago
Question
Answered: 1 week ago
Question
Answered: 1 week ago
Question
Answered: 1 week ago
Question
Answered: 1 week ago
Question
Answered: 1 week ago
View Answer in SolutionInn App


