

Question: The table shows the values found in the error analysis. What method of forecasting would be best to use? What is the forecasted value? MSE
The table shows the values found in the error analysis. What method of forecasting would be best to use? What is the forecasted value? MSE forecast for week 13 Time Series 1.08 14.76 3-week MA 3.04 13.67 exp smoothing 11.04 9.5 Group of answer choices Time Series, forecasted value = 14.76 3-week MA, forecasted value = 13.67 exp smoothing, forecasted value = 9.5 Time Series, forecasted value = 1.08 3-week MA, forecasted value = 3.04 exp smoothing, forecasted value = 11.04
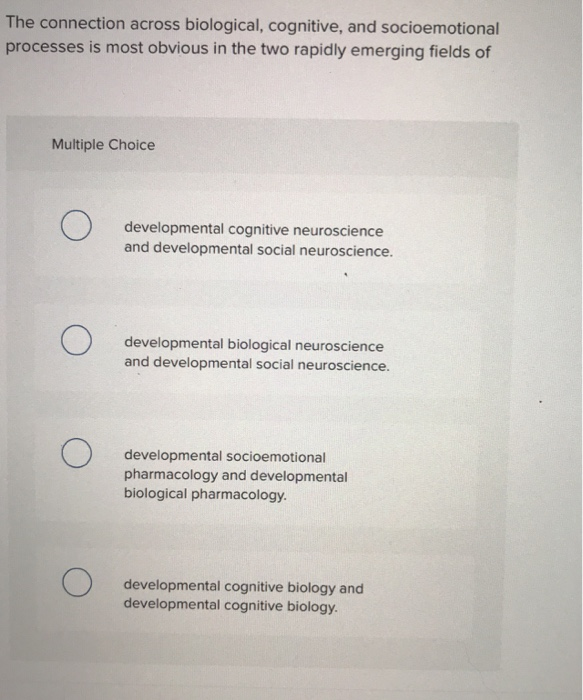
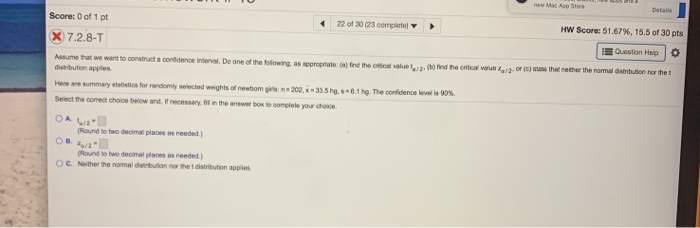
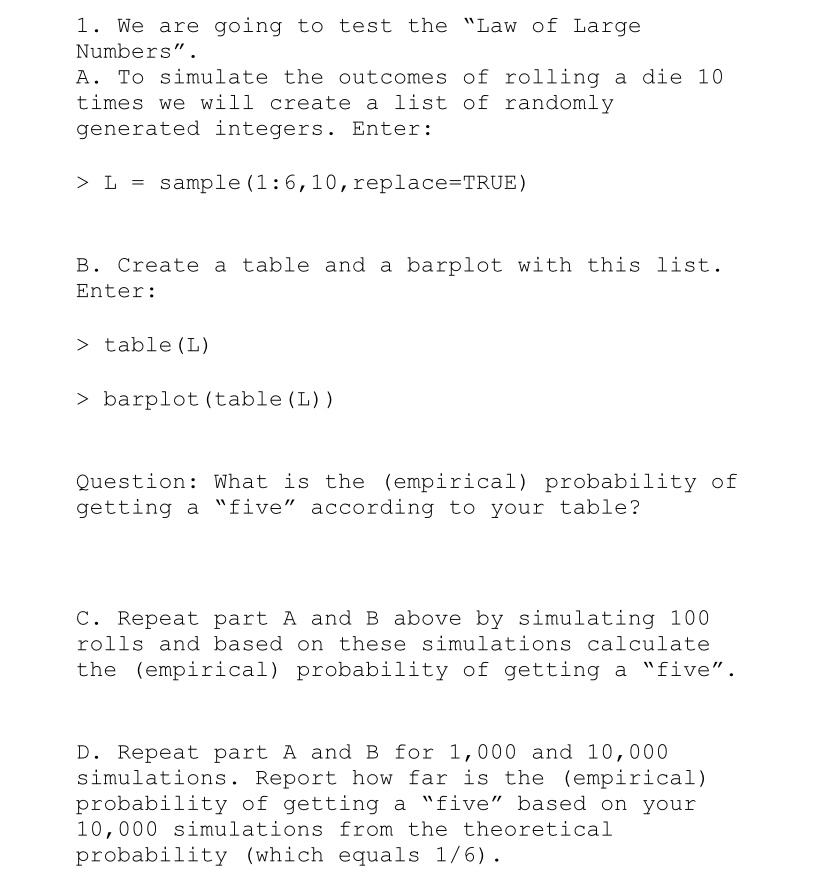
The connection across biological, cognitive, and socioemotional processes is most obvious in the two rapidly emerging fields of Multiple Choice O developmental cognitive neuroscience and developmental social neuroscience. O developmental biological neuroscience and developmental social neuroscience. O developmental socioemotional pharmacology and developmental biological pharmacology. O developmental cognitive biology and developmental cognitive biology.now Mad Fop Store Score: 0 of 1 pt 22 of 30 (23 complato) HW Score: 51.679%, 15.5 of 30 pts X) 7.2.8-T IQuestion Hep Assume that we want to construct a conidence interval. Do one of the folowing. as repropriate: () find the offical value ting. (b) find he onical vous 52. or jo) sis that mether the normal damnbuton nar the : distribution apples. Have are summary statistics for randomly selected weights of newtom girls: no 202, x = 33.5 hg. s = 6.1 hg. The confidence level is 9Oh. Select the comed choice below and, If necessary fill in the answer bow to complete your choice. [Found to two decimal places as needed.) (Hound to two dooimal places as reeded.) O C. Neither the normal distribution for the t distribution applica.1. We are going to test the \"Law of Large Numbers". A. To simulate the outcomes of rolling a die 10 times we will create a list of randomly generated integers. Enter: > L sample(1:6,10,replace=TRUE) B. Create a table and a barplot with this list. Enter: > tabletL) > barplot[table{L)} Question: What is the (empirical) probability of getting a \"five\" according to your table? C. Repeat part A and B above by simulating 100 rolls and based on these simulations calculate the (empirical) probability of getting a \"five". D. Repeat part A and E for 1,000 and 10,000 simulations. Report how far is the (empirical) probability of getting a \"five\" based on your 10,000 simulations from the theoretical probability (which equals 1/6)
Step by Step Solution
There are 3 Steps involved in it

Get step-by-step solutions from verified subject matter experts