Question
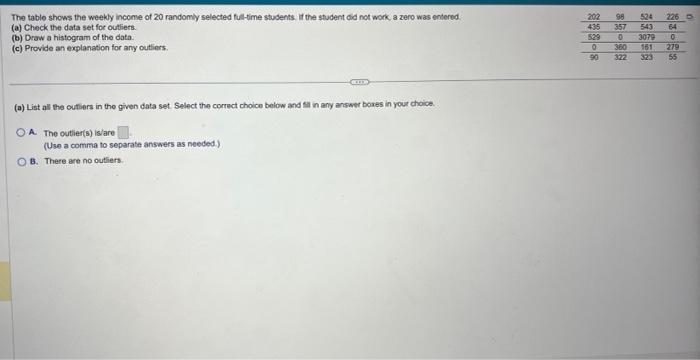
The table shows the weekly income of 20 randomly selected full-time students. If the student did not work, a zero was entered (a) Check

The table shows the weekly income of 20 randomly selected full-time students. If the student did not work, a zero was entered (a) Check the data set for outliers. (b) Draw a histogram of the data. (c) Provide an explanation for any outliers. (a) List all the outliers in the given data set. Select the correct choice below and fill in any answer boxes in your choice. A. The outlier(s) is/are (Use a comma to separate answers as needed.) B. There are no outliers. 202 98 435 357 529 524 226 - 543 64 0 3079 161 279 360 322 323 55 TINT 0 90 77 0 0
Step by Step Solution
3.34 Rating (151 Votes )
There are 3 Steps involved in it
Step: 1
from above putting data in ascending order X 0 0 0 0 0 82 105 113 163 223 240 250 25...
Get Instant Access to Expert-Tailored Solutions
See step-by-step solutions with expert insights and AI powered tools for academic success
Step: 2

Step: 3

Ace Your Homework with AI
Get the answers you need in no time with our AI-driven, step-by-step assistance
Get StartedRecommended Textbook for
Fundamentals Of Statistics
Authors: Michael Sullivan III
4th Edition
978-032184460, 032183870X, 321844602, 9780321838704, 978-0321844606
Students also viewed these Accounting questions
Question
Answered: 1 week ago
Question
Answered: 1 week ago
Question
Answered: 1 week ago
Question
Answered: 1 week ago
Question
Answered: 1 week ago
Question
Answered: 1 week ago
Question
Answered: 1 week ago
Question
Answered: 1 week ago
Question
Answered: 1 week ago
Question
Answered: 1 week ago
Question
Answered: 1 week ago
Question
Answered: 1 week ago
Question
Answered: 1 week ago
Question
Answered: 1 week ago
Question
Answered: 1 week ago
Question
Answered: 1 week ago
Question
Answered: 1 week ago
Question
Answered: 1 week ago
Question
Answered: 1 week ago
Question
Answered: 1 week ago
View Answer in SolutionInn App


