Question
The term project is the valuation of a privately held company, Manny Quinn Enterprises for purposes of a sale. Which means you will need to:
The term project is the valuation of a privately held company, Manny Quinn Enterprises for purposes of a sale. Which means you will need to: Project cash flows for the company with the following assumptions: Normalized EBIT for Wholesale was $40,000 in 2010. Depreciation expense at 2% of revenue CapEx growth of 6% Working capital to sales of 3.5% Assume a tax rate for the buyer of 30% Cost of debt = 6% Obviously, you will also need the following, which will be determined by you. Long term growth rate Estimate of the risk free rate Estimate of the Equity risk premium, which should be adjusted for outside factors, such as the illiquidity of a private company; limited geographic market; dependence on key personnel; Competitive nature of the eyewear market, etc. Using this information to produce an estimated valuation of the company (a LOGICAL, easy to follow, Excel spreadsheet) and a summary of the valuation designed to be given to the owners of Manny Quinn, explaining the valuation and how was reached. You will be graded based on your process (therefore, make sure it is clear!) and the quality of the presentation to the owners. FINC 760 Term Project Manny Quinn Enterprises Business Profile A. Overview of the Manny Quinn Entities The Company is a retailer and wholesaler of basic, fashionable, and sport/performance eyewear with 2010 combined revenues of about $6.0 million (excluding inter-company revenues). Business was conducted through two retail stores (#1 and #2), a management company (Management) and an eyewear wholesaler (Wholesale). B. Competitive Environment, Business Risks & Opportunities According to information provided by management, the Company had both advantages and disadvantages relative to its competitors. The Companys long history and reputation for quality and superior service were seen as strengths. Competitive hurdles included: (1) an increasingly more competitive market resulting from insurance-capped billings; (2) difficulty to compete with national competitors that had multiple locations in the Companys primary market, including those with lower cost employees; (3) customers that do not perceive the price/value relationship; and (4) increasing competition from web sales. Business Risks: Although the Company is subject to several different macro (general) and micro (company-specific), the most significant threats to the Companys revenues and profits are highlighted below. Key Person Risk: Management and others indicated that Manny Quinn was instrumental to the development of the business and the execution of the Companys growth plans. Geographic Concentration: The Company's optical store business is closely linked to local economic conditions in the Atlanta trade area, thus making it vulnerable to economic downturns throughout the region. The general economy and financial market performance have a direct impact on the Company's operations. Competitive Risks: Although the Company had a loyal customer base for its stores, abundant substitutes were available, including similar products sold at online retailers as well as at the locations of local and national competitors. Based on information provided by Mr. Quinn, there were several dozen competing companies within three miles of the Company's retail stores. This made it difficult to stand out in a crowded marketplace. We believe the Manny Quinn name however, helped somewhat to mitigate this issue. Opportunities: At the Valuation Date, the following were identified as ways the Company could increase its presence in the eyewear market: (1) it could leverage its large inventory of iconic frame designs into increased wholesale sales as trends changed in its direction; (2) it had a long history of its product being worn by celebrities in various fields, including prominent actors which helps with store sales and starting up its wholesale business; and (3) undeveloped (albeit speculative) web sales opportunity. The Company had distributors/retailers in certain countries to build on; however it was unclear how beneficial certain of them would be in the future. Economic Outlook In its Quarterly Economic Review, dated August 27, 2010, Value Line stated that the U.S. economy was on a shaky, but possibly sustainable upward course. However, a noticeable loss in momentum during the second quarter of 2010 raised concerns about the likelihood of a potential double-dip recession. GDP Growth: According to Value Line, early data on housing, construction, retail sales and employment suggested that the pace of economic growth would mostly likely remain unchanged in the near term. Despite improving activity on both the manufacturing and non-manufacturing fronts, Value Line forecast that GDP would increase just 1.5% during the third quarter of 2010. Only a nominally better pace was anticipated during 2010s fourth quarter, due to: (1) continued pressures brought about by a soft housing market; (2) lackluster demand for non-residential construction; and (3) tight credit conditions. For 2011, GDP was projected to grow by 2.3%. Thereafter, only moderate improvements in GDP were expected to occur, with growth averaging roughly 3.0% per year through 2014. Inflation: Given the lack of any appreciably stronger business expansion, the threat of inflation was expected to be benign for the next few years. This was being further supported by the presence of a relatively calm pricing environment, as well as significant excess capacity in product markets. As the economic expansion begins to mature, Value Line expected that increased pricing pressure would lead to at least a modest uptick in inflation. Over the five years ending 2014, Value Line projected that producer and consumer prices would increase at compound annual rates of 2.1 % and 1.9%, respectively. However, concern remained over the possibility of deflation due to a historically low interest rate environment. While considered only a modest risk factor, it was the opinion of Value Line that the presence of a weak business expansion, sharp declines in global commodities prices and limited options available to the Fed on the fiscal and monetary front provided at least some cause for concern. Interest Rates: The Fed was holding short-term maturities near zero and no rate changes were expected to occur through most, if not all, of 2011. While this move was necessary to bolster the U.S. economy during the recession, the Fed was expected to have little latitude to affect new monetary or fiscal policy initiatives going forward. Additionally, it was unlikely that the Fed would contemplate raising rates any sooner due to many of the factors discussed previously. Longer-term interest rates, such as those on ten-year Treasury notes and twenty year Treasury bonds, were also forecast to remain stable over the forecast period. Corporate Earnings: During 2009, corporate earnings improved considerably due mainly to ongoing cost cutting measures. With earnings pushing strongly ahead in the first and second quarters of 2010, it became evident that it was more than just the cost side of the equation that was on the mend. Several companies were posting higher revenues brought about by a mix of accelerating demand and price increase. Even so, the rate of growth was anticipated to moderate in the third quarter, and a more notable backtracking was considered possible in the final quarter of the year. Value Line believed that corporate profits would stumble in 2011, or at least experience some moderation, before picking up the pace again in 2012. Industry Outlook A. Industry Overview In the five years to 2010, IBIS estimated that industry revenue for eyeglass retailers would grow by an average annualized rate of 2.2%. The medical nature of eye care purchases cushioned sales of eyewear goods during the challenging operating climates of 2008 and 2009. While revenue decreased in the recessionary years, it was expected to grow by 7.8% in 2 010. This strong growth off of two years of downward trends reflected a turnaround in consumer sentiment combined with other industry tailwinds. Favorable changes in demographics, mainly from an aging population, were bolstering the industrys resilience to economic downturns. While industry operators faced a deep recession in 2008 and 2009, eyewear store sales were minimally weakened. The threat of substitute technologies and direct marketers had driven the industry to adapt new pricing and product strategies. The eyeglass wholesaling industry experienced similar results in the five years to 2010. This industry was comprised of distributors who sold professional equipment, instruments and goods to eyewear retailers and eye doctors. Consequently, the performance of the eyeglass retail industry had a significant impact on eyeglass wholesaling revenue. Nevertheless, in the five years to 2010, growth in retail sales did not translate entirely into improved revenue for the wholesaling industry, since sales were curbed by heightened competition. Manufacturers had brought distribution in-house instead of using independent wholesalers, shifting revenue away from the industry. As a result, IBIS estimated that industry revenue grew at annualized 1.2% in the five years to 2010. B. Competitive Landscape Market Segments: The eyeglass retail industry was divided into the following segments: (1) consumers aged 55 to 64 years (30% of industry revenue); (2) consumers aged 65 years and older (20%); (3) consumers aged 35 to 44 years (17%); (4) consumers aged 25 to 34 years (15%); (5) consumers aged 15 to 24 years old (13%); (6) consumers aged 14 years and younger (5%). Major Players: The major players in the industry, defined as companies with greater than 5% market share, were: (1) Luxottica Group S.p.A. (30.2% market share); (2) Walmart (15.3%); (3) National Vision, Inc. (7.2%); (4) Costco (6%). Basis of competition: Factors such as consolidation among retail chains and the emergence of optical departments in discount retailers resulted in significant competition within the eyewear retail industry. Price was a particularly important competitive factor for nonessential goods, including fashion eyewear and colored contact lenses. These purchases were typically not covered by insurance and, as an optional purchase, were subject to changes in consumer sentiment. Consequently, stores whose product mix was concentrated in nonprescription eyewear competed more intensely on price. Industry players also competed on the basis of convenience, product quality, selection and marketing. Key Success Factors: According to IBIS, the key success factors included: (1) ability to control stock on hand; (2) ability to franchise operations; (3) proximity to key markets; (4) maintenance of excellent customer relations; (5) ability to alter product mix in favor of market conditions; and (6) differentiated value strategy. Barriers to Entry: Barriers to entry in the eyeglass retail industry were medium and steady. Ophthalmologists, optometrists and opticians required distinct levels of licensing that made it difficult to open a new location or begin dispensing for the first time. This was particularly applicable to non-employers or single location stores without prior licenses. However, eyewear retailers were subject to various legal requirements that regulated the permitted relationships between licensed optometrists and ophthalmologists, who performed eye exams and prescribed corrective lenses, and opticians, who filled such prescriptions and sold eyeglass frames. Recent rules that made eyewear prescriptions the property of patients, and thus transferrable to any optician, reduced the regulatory barrier to entry. Distribution was another potential barrier to entry, as existing eyeglass retailers could build strong relationships with their suppliers, which could improve delivery of products and the ability to source quality items. Supplier relationships could prohibit a new entrant from accessing low priced, high quality merchandise. C. Trends and Outlook Retail Industry: Favorable economic, demographic and pricing trends would drive growth for eyeglass retailers in the five years to 2015. However, this growth would be restrained since the majority of consumers in need of eyewear already had the products, and new product development was not revolutionary enough to negate extensive purchases. Hence, sales would stem from population growth and market consolidation. IBIS forecast that industry revenue would grow at an average annualized rate of 3.5% per year to 2015. While high price points would likely not return in the near future, sales of fashion-oriented eyewear, such as sunglasses and brand name frames, would benefit from strengthening consumer sentiment. These purchases were often a luxury, so they were dependent on sufficient levels of consumer income and confidence. Wholesale Industry: The eyeglass wholesaling industry was forecast to expand moderately over the five years to 2015, supported by the introduction of new products, an aging population and an improving economic situation. Industry revenue was forecast to increase by 1.3% for the five years ending in 2015. Additionally, the increased demand for fashion-oriented eyewear would help raise profitability for eyewear


THIS IS IT, THERE IS NO MORE DETAILES. PROJECT IS BASED ON RATIONAL ASSUMPTIONS TO VALUATE THE COMPANY.
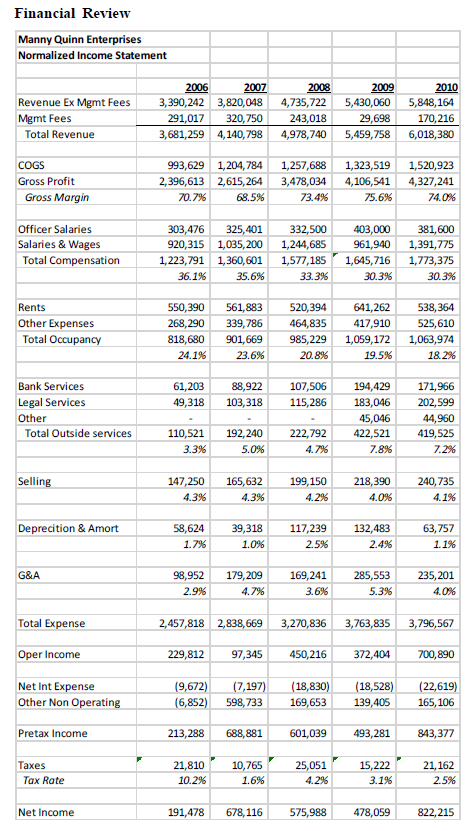
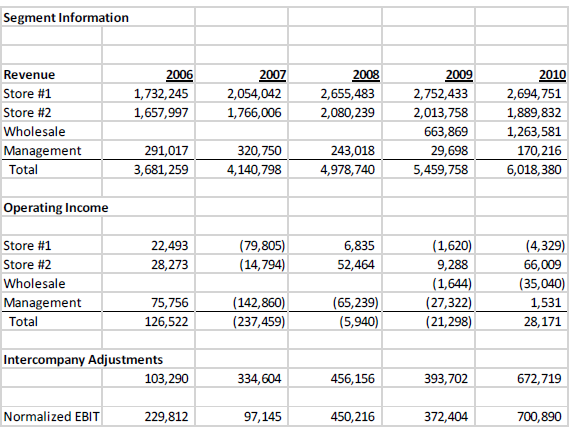
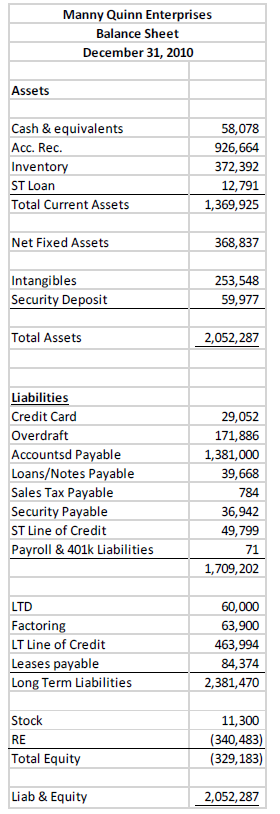
Financial Review Manny Quinn Enterprises Normalized Income Statement Revenue Ex Mgmt Fees Mgmt Fees Total Revenue 2006 2007 3,390,242 3,820,048 291,017 320,750 3,681,259 4,140,798 2008 4,735,722 243,018 4,978,740 2009 5,430,060 29,698 5,459,758 2010 5,848,164 170,216 6,018,380 COGS Gross Profit Gross Margin 993,629 1,204,784 2,396,613 2,615,264 70.7% 68.5% 1,257,688 3,478,034 73.4% 1,323,519 4,106,541 75.6% 1,520,923 4,327,241 74.0% Officer Salaries Salaries & Wages Total Compensation 303,476 325,401 920,315 1,035, 200 1,223,791 1,360,601 36.1% 35.6% 332,500 1,244,685 1,577,185 33.3% 403,000 961,940 1,645,716 30.3% 381,600 1,391,775 1,773,375 30.3% Rents Other Expenses Total Occupancy 550,390 268,290 818,680 24.1% 561,883 339,786 901,669 23.6% 520,394 464,835 985,229 20.8% 641,262 417,910 1,059,172 19.5% 538,364 525,610 1,063,974 18.2% 61,203 49,318 88,922 103,318 107,506 115,286 Bank Services Legal Services Other Total Outside services 194,429 183,046 45,046 422,521 7.8% 171,966 202,599 44,960 419,525 7.2% 110,521 3.3% 192,240 5.0% 222,792 4.7% Selling 147,250 4.3% 165,632 4.3% 199,150 4.2% 218,390 4.0% 240,735 4.1% Deprecition & Amort 58,624 1.7% 39,318 1.0% 117,239 2.5% 132,483 2.4% 63,757 1.1% G&A 98,952 2.9% 179,209 4.7% 169,241 3.6% 285,553 5.3% 235, 201 4.0% Total Expense 2,457,818 2,838,669 3,270,836 3,763,835 3,796,567 Oper Income 229,812 97,345 450,216 372,404 700,890 Net Int Expense Other Non Operating (9,672) (6,852) (7,197) 598,733 (18,830) 169,653 (18,528) 139,405 (22,619) 165, 106 Pretax Income 213,288 688,881 601,039 493,281 843,377 Taxes Tax Rate 21,810 10.2% 10,765 1.6% 25,051 4.2% 15,222 3.1% 21,162 2.5% Net Income 191,478 678, 116 575,988 478,059 822,215 Segment Information 2006 1,732, 245 1,657,997 2007 2,054,042 1,766,006 2008 2,655,483 2,080,239 Revenue Store #1 Store #2 Wholesale Management Total 2009 2,752,433 2,013,758 663,869 29,698 5,459,758 2010 2,694,751 1,889,832 1,263,581 170,216 6,018,380 291,017 3,681,259 320,750 4,140,798 243,018 4,978,740 Operating Income 22,493 28,273 (79,805) (14,794) 6,835 52,464 Store #1 Store #2 Wholesale Management Total (1,620) 9,288 (1,644) (27,322) (21,298) (4,329) 66,009 (35,040) 1,531 28,171 75,756 126,522 (142,860) (237,459) (65,239) (5,940) Intercompany Adjustments 103,290 334,604 456,156 393,702 672,719 Normalized EBIT 229,812 97,145 450,216 372,404 700,890 Manny Quinn Enterprises Balance Sheet December 31, 2010 Assets Cash & equivalents Acc. Rec. Inventory ST Loan Total Current Assets 58,078 926,664 372,392 12,791 1,369,925 Net Fixed Assets 368,837 Intangibles Security Deposit 253,548 59,977 Total Assets 2,052,287 Liabilities Credit Card Overdraft Accounts Payable Loans/Notes Payable Sales Tax Payable Security Payable ST Line of Credit Payroll & 401k Liabilities 29,052 171,886 1,381,000 39,668 784 36,942 49,799 71 1,709,202 LTD Factoring LT Line of Credit Leases payable Long Term Liabilities 60,000 63,900 463,994 84,374 2,381,470 Stock RE Total Equity 11,300 (340,483) (329,183) Liab & Equity 2,052,287 Financial Review Manny Quinn Enterprises Normalized Income Statement Revenue Ex Mgmt Fees Mgmt Fees Total Revenue 2006 2007 3,390,242 3,820,048 291,017 320,750 3,681,259 4,140,798 2008 4,735,722 243,018 4,978,740 2009 5,430,060 29,698 5,459,758 2010 5,848,164 170,216 6,018,380 COGS Gross Profit Gross Margin 993,629 1,204,784 2,396,613 2,615,264 70.7% 68.5% 1,257,688 3,478,034 73.4% 1,323,519 4,106,541 75.6% 1,520,923 4,327,241 74.0% Officer Salaries Salaries & Wages Total Compensation 303,476 325,401 920,315 1,035, 200 1,223,791 1,360,601 36.1% 35.6% 332,500 1,244,685 1,577,185 33.3% 403,000 961,940 1,645,716 30.3% 381,600 1,391,775 1,773,375 30.3% Rents Other Expenses Total Occupancy 550,390 268,290 818,680 24.1% 561,883 339,786 901,669 23.6% 520,394 464,835 985,229 20.8% 641,262 417,910 1,059,172 19.5% 538,364 525,610 1,063,974 18.2% 61,203 49,318 88,922 103,318 107,506 115,286 Bank Services Legal Services Other Total Outside services 194,429 183,046 45,046 422,521 7.8% 171,966 202,599 44,960 419,525 7.2% 110,521 3.3% 192,240 5.0% 222,792 4.7% Selling 147,250 4.3% 165,632 4.3% 199,150 4.2% 218,390 4.0% 240,735 4.1% Deprecition & Amort 58,624 1.7% 39,318 1.0% 117,239 2.5% 132,483 2.4% 63,757 1.1% G&A 98,952 2.9% 179,209 4.7% 169,241 3.6% 285,553 5.3% 235, 201 4.0% Total Expense 2,457,818 2,838,669 3,270,836 3,763,835 3,796,567 Oper Income 229,812 97,345 450,216 372,404 700,890 Net Int Expense Other Non Operating (9,672) (6,852) (7,197) 598,733 (18,830) 169,653 (18,528) 139,405 (22,619) 165, 106 Pretax Income 213,288 688,881 601,039 493,281 843,377 Taxes Tax Rate 21,810 10.2% 10,765 1.6% 25,051 4.2% 15,222 3.1% 21,162 2.5% Net Income 191,478 678, 116 575,988 478,059 822,215 Segment Information 2006 1,732, 245 1,657,997 2007 2,054,042 1,766,006 2008 2,655,483 2,080,239 Revenue Store #1 Store #2 Wholesale Management Total 2009 2,752,433 2,013,758 663,869 29,698 5,459,758 2010 2,694,751 1,889,832 1,263,581 170,216 6,018,380 291,017 3,681,259 320,750 4,140,798 243,018 4,978,740 Operating Income 22,493 28,273 (79,805) (14,794) 6,835 52,464 Store #1 Store #2 Wholesale Management Total (1,620) 9,288 (1,644) (27,322) (21,298) (4,329) 66,009 (35,040) 1,531 28,171 75,756 126,522 (142,860) (237,459) (65,239) (5,940) Intercompany Adjustments 103,290 334,604 456,156 393,702 672,719 Normalized EBIT 229,812 97,145 450,216 372,404 700,890 Manny Quinn Enterprises Balance Sheet December 31, 2010 Assets Cash & equivalents Acc. Rec. Inventory ST Loan Total Current Assets 58,078 926,664 372,392 12,791 1,369,925 Net Fixed Assets 368,837 Intangibles Security Deposit 253,548 59,977 Total Assets 2,052,287 Liabilities Credit Card Overdraft Accounts Payable Loans/Notes Payable Sales Tax Payable Security Payable ST Line of Credit Payroll & 401k Liabilities 29,052 171,886 1,381,000 39,668 784 36,942 49,799 71 1,709,202 LTD Factoring LT Line of Credit Leases payable Long Term Liabilities 60,000 63,900 463,994 84,374 2,381,470 Stock RE Total Equity 11,300 (340,483) (329,183) Liab & Equity 2,052,287Step by Step Solution
There are 3 Steps involved in it
Step: 1

Get Instant Access to Expert-Tailored Solutions
See step-by-step solutions with expert insights and AI powered tools for academic success
Step: 2

Step: 3

Ace Your Homework with AI
Get the answers you need in no time with our AI-driven, step-by-step assistance
Get Started


